Get continuous performance data without major overhead.
Does your team often get surprised by end users calling to complain about performance problems? Have you ever not had the details needed to see what was causing a performance problem? Are you struggling with a proactive approach to managing performance? Do you have someone manually documenting WRKSYSSTS or WRKDSKSTS output?
Think Robot/NETWORK Explorer.
On IBM i, performance doesn't have to be an issue: The operating system gives you the ability to continuously collect performance data—without major overhead on the system.
IBM i has a feature called Collection Services, a tool set designed by IBM to gather the performance data on IBM i and store it in intervals inside a collection object (object type *MGTCOL). These objects store the raw performance data that reflects an interval of time and the performance of the system, jobs, memory pools, and disk.
This data is essential for a few good business reasons. It can be used to diagnosis performance issues, plan for future growth, or monitor performance for exceptions before a problem occurs. The command CRTPFRDTA processes the data in the *MGTCOL object and outputs it to performance database files where you can harvest the data with a high-level program or use some other IBM tools—like performance tools—to look at the data.
The STRPFRCOL command allows you to start the process that monitors the data and controls the intervals for taking snapshots of the data. IBM now recommends running performance collections constantly as part of normal operations.
Precision Intervals
Performance collection data can be evoked and run through system APIs, as well as through IBM i Navigator and these commands. We use APIs in many software solutions at Help/Systems. It keeps us performing at an optimal speed, too.
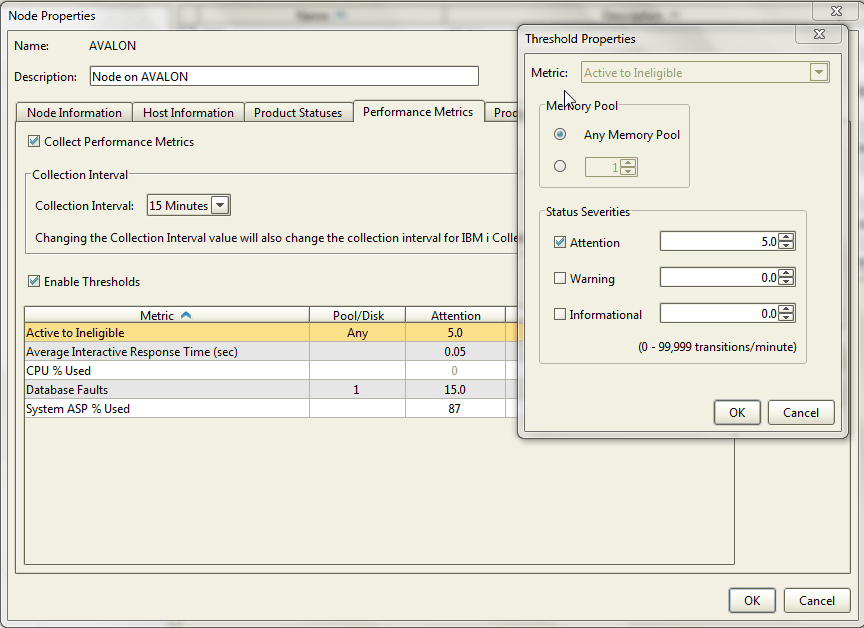
In Robot/NETWORK Explorer, you can set up the interval for collections down to seconds (Figure 1). Each partition in Robot/NETWORK can establish the collection interval differently.

Figure 1: This is an example of "Active to Ineligible" values.
Management by Exception = SLA Delivered
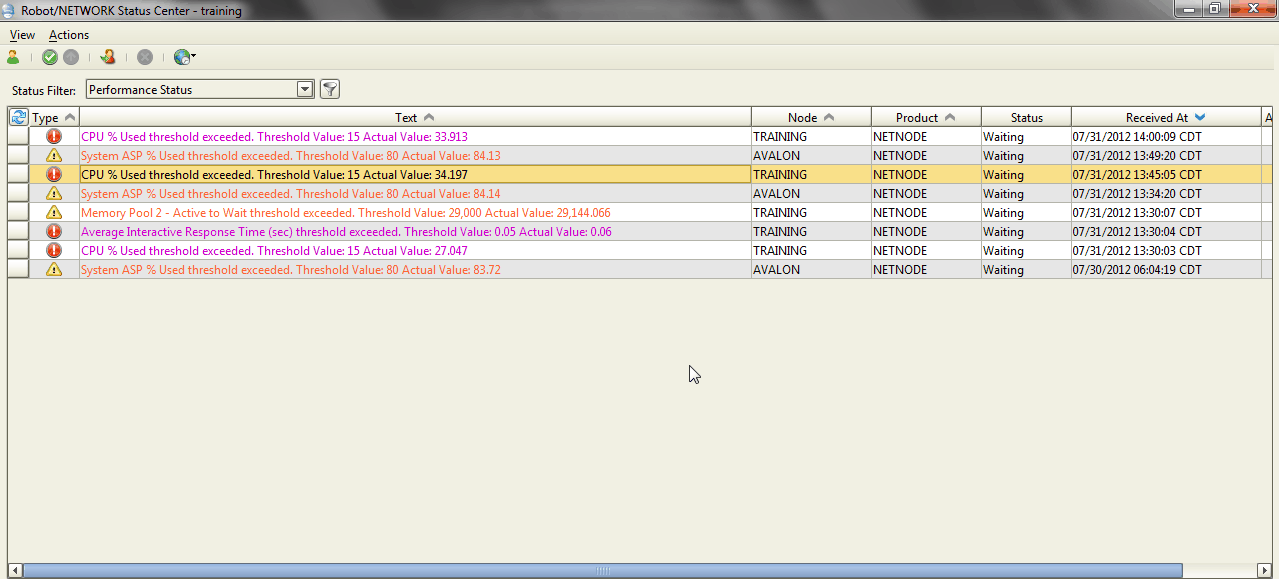
Managing your server by exception is especially important for performance data, and Robot/NETWORK makes it easy to add exception-based monitoring. It lets you configure elements of performance by each partition, allowing you to choose only important items from WRKSYSSTS or WRKDSKSTS. For instance, you might want to get alerted if you go over a threshold of .05 seconds for average response time or if your active to ineligible value is greater than 5 (Figure 2). This is very easy to do, by partition or across IBM i.

Figure 2: The Status Center shows events as you exceed your desired threshold.
Top-Flight Dashboards
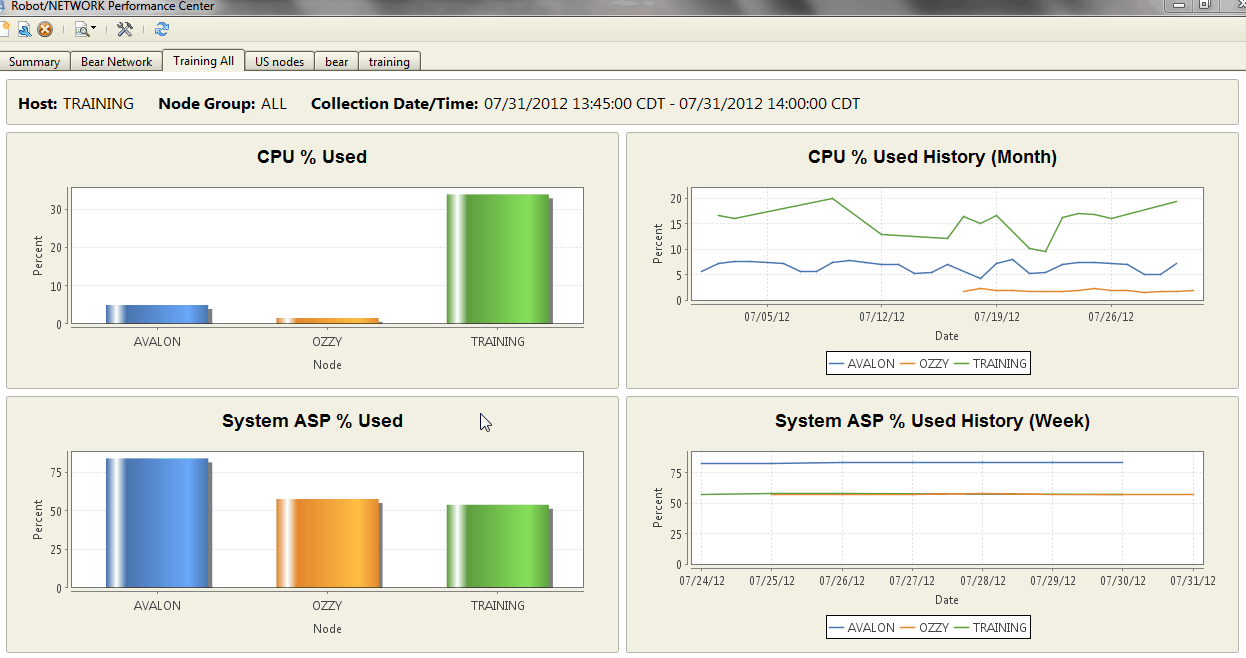
Robot/NETWORK also features auto-refreshing dashboards (Figure 3) to keep you apprised of your most recent data. The product can also alert you for each interval collection, which can also be summarized and compared to the threshold. Threshold events go to the status center, which in turn can be set to notify you via SNMP, email, pop-up window, or desktop alert.

Figure 3: The Robot/NETWORK dashboard is part of the product's new Performance Center.
Meet Your SLA
Robot/NETWORK from Help/Systems keeps you abreast of any potential overage on your SLA. See how your data center can be more proactive with Robot/NETWORK today.


 More than ever, there is a demand for IT to deliver innovation. Your IBM i has been an essential part of your business operations for years. However, your organization may struggle to maintain the current system and implement new projects. The thousands of customers we've worked with and surveyed state that expectations regarding the digital footprint and vision of the company are not aligned with the current IT environment.
 TRY the one package that solves all your document design and printing challenges on all your platforms. Produce bar code labels, electronic forms, ad hoc reports, and RFID tags – without programming! MarkMagic is the only document design and print solution that combines report writing, WYSIWYG label and forms design, and conditional printing in one integrated product. Make sure your data survives when catastrophe hits. Request your trial now! Request Now.
 Forms of ransomware has been around for over 30 years, and with more and more organizations suffering attacks each year, it continues to endure. What has made ransomware such a durable threat and what is the best way to combat it? In order to prevent ransomware, organizations must first understand how it works.
 Disaster protection is vital to every business. Yet, it often consists of patched together procedures that are prone to error. From automatic backups to data encryption to media management, Robot automates the routine (yet often complex) tasks of iSeries backup and recovery, saving you time and money and making the process safer and more reliable. Automate your backups with the Robot Backup and Recovery Solution. Key features include:
 Business users want new applications now. Market and regulatory pressures require faster application updates and delivery into production. Your IBM i developers may be approaching retirement, and you see no sure way to fill their positions with experienced developers. In addition, you may be caught between maintaining your existing applications and the uncertainty of moving to something new.
 IT managers hoping to find new IBM i talent are discovering that the pool of experienced RPG programmers and operators or administrators with intimate knowledge of the operating system and the applications that run on it is small. This begs the question: How will you manage the platform that supports such a big part of your business? This guide offers strategies and software suggestions to help you plan IT staffing and resources and smooth the transition after your AS/400 talent retires. Read on to learn:
LATEST COMMENTS
MC Press Online