You won't regret taking this proactive approach to monitoring performance!
How do you know what level of performance is acceptable for your IBM i server? What's an acceptable average for response time, database and non-database fault rate, number of seizes and locks, or average disk rate? Many of us don't even know what an acceptable CPU percent is on our server.
Even if you know the metric average that you want, how is your team warned when you exceed a threshold? Do you get a report from IBM later in the week? Does your administrator or operator record this information manually so you can compare it to last week?
The reality is that most of us don't know what's normal for our systems when it comes to performance metrics. Often, this is because "normal" on one system, disk unit, or memory pool is "abnormal" for another as a result of stricter Service Level Agreements (SLAs) on one or the other.
If it's my shop, I want to know about potential problems before they become a reality. Many customers tell us that each operator manually records CPU, DASD, average response time, and other performance statistics during their shift. If you really want to know the health of your system, you need a tool that can read system performance information continuously, summarize it, and then compare it to a reasonable threshold.
Automate System Performance Monitoring
The Robot/NETWORK Performance Center has attracted a lot of attention since its release. That's because we've made performance monitoring on IBM i simple. By integrating it with our product consolidation tool, Robot/NETWORK, you can take advantage of escalation and notification processes you already have in place.
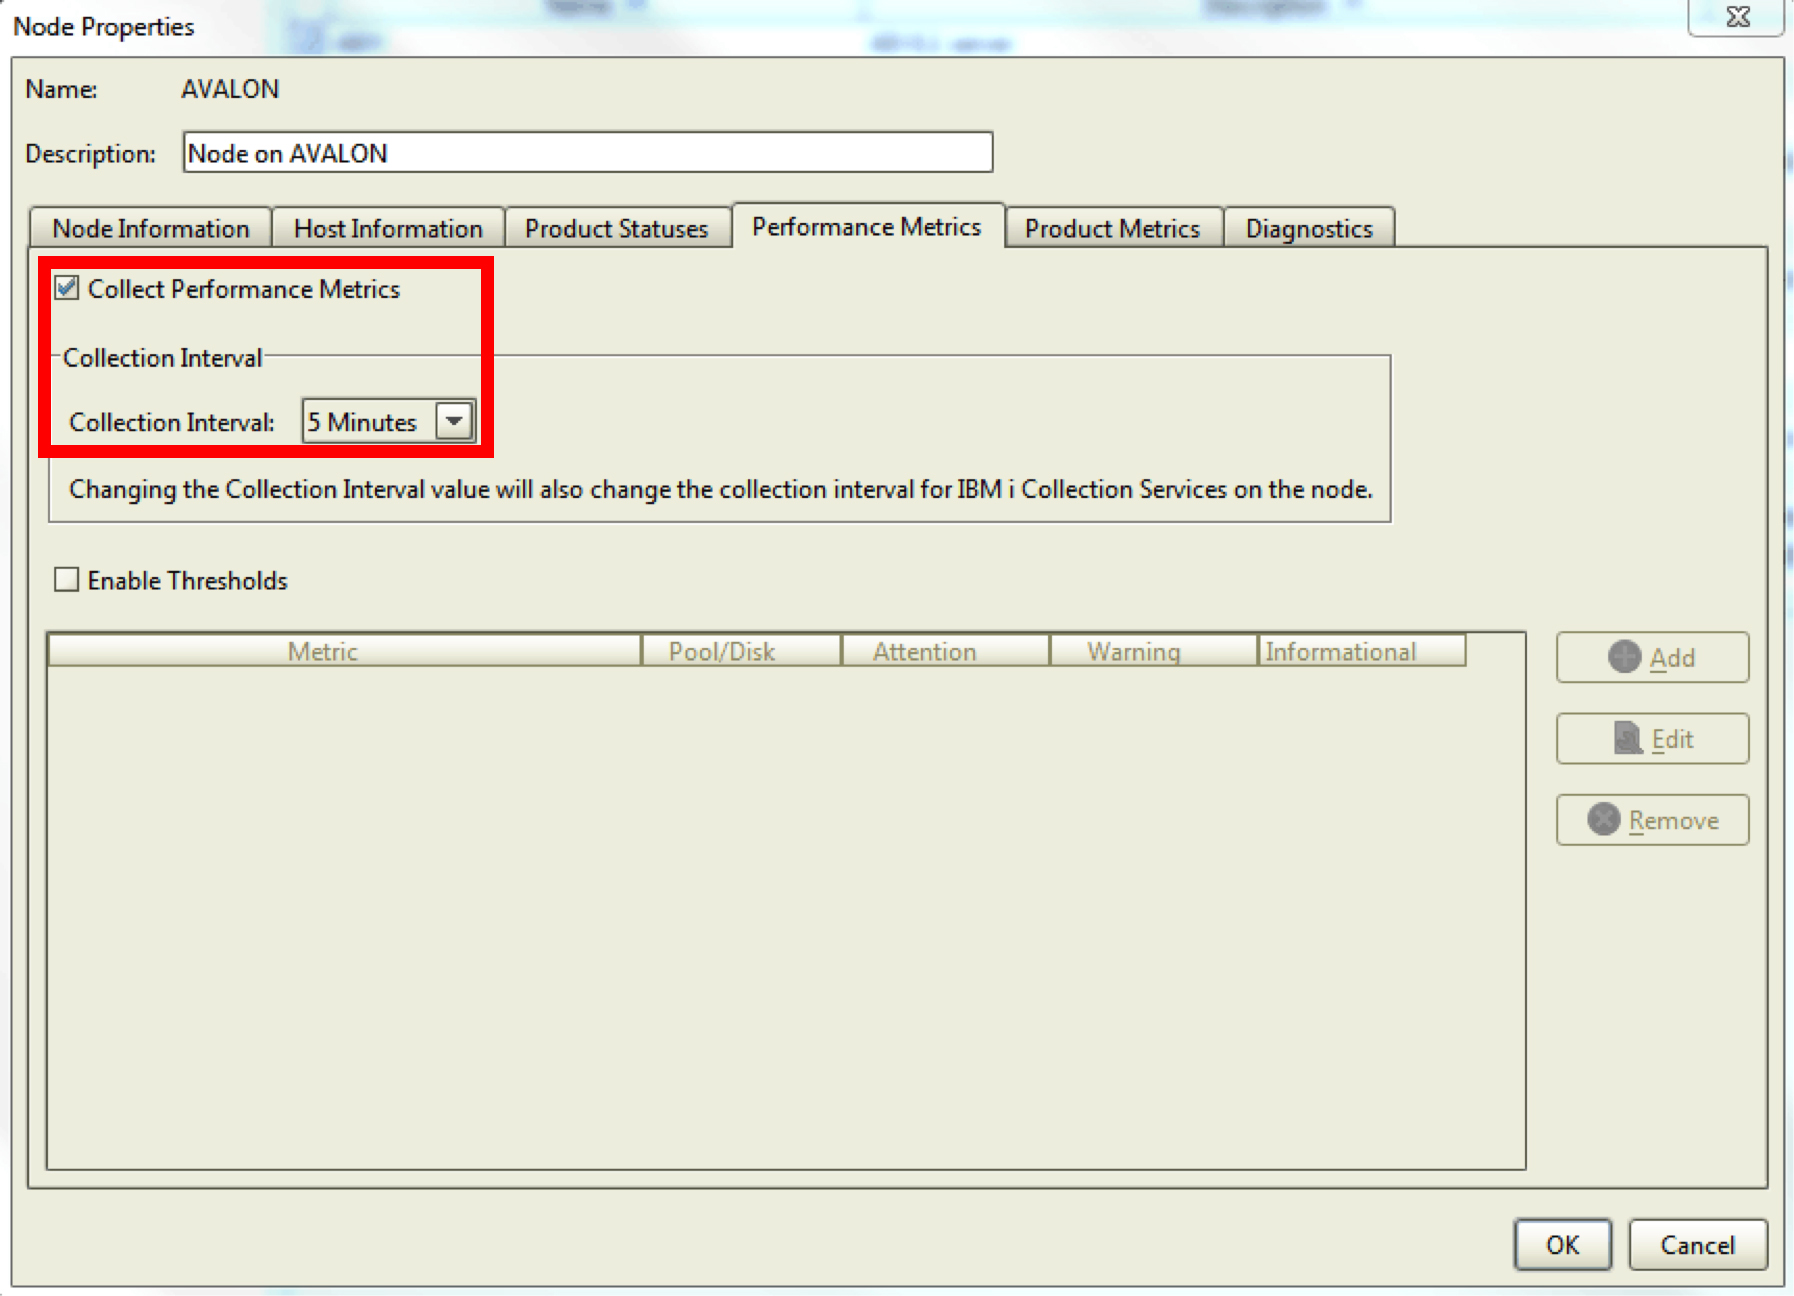
Performance Center's dynamic, drill-down-capable dashboards, graphs, and charts keep your finger on the pulse of your system's health. Plus, you get more control over that data with Performance Center's abilities for exception notification, multiple thresholds, and more. Simply turn on Collection Service and Robot/NETWORK continuously gathers this information across your network of IBM i partitions.

Figure 1: Establish performance collection interval.
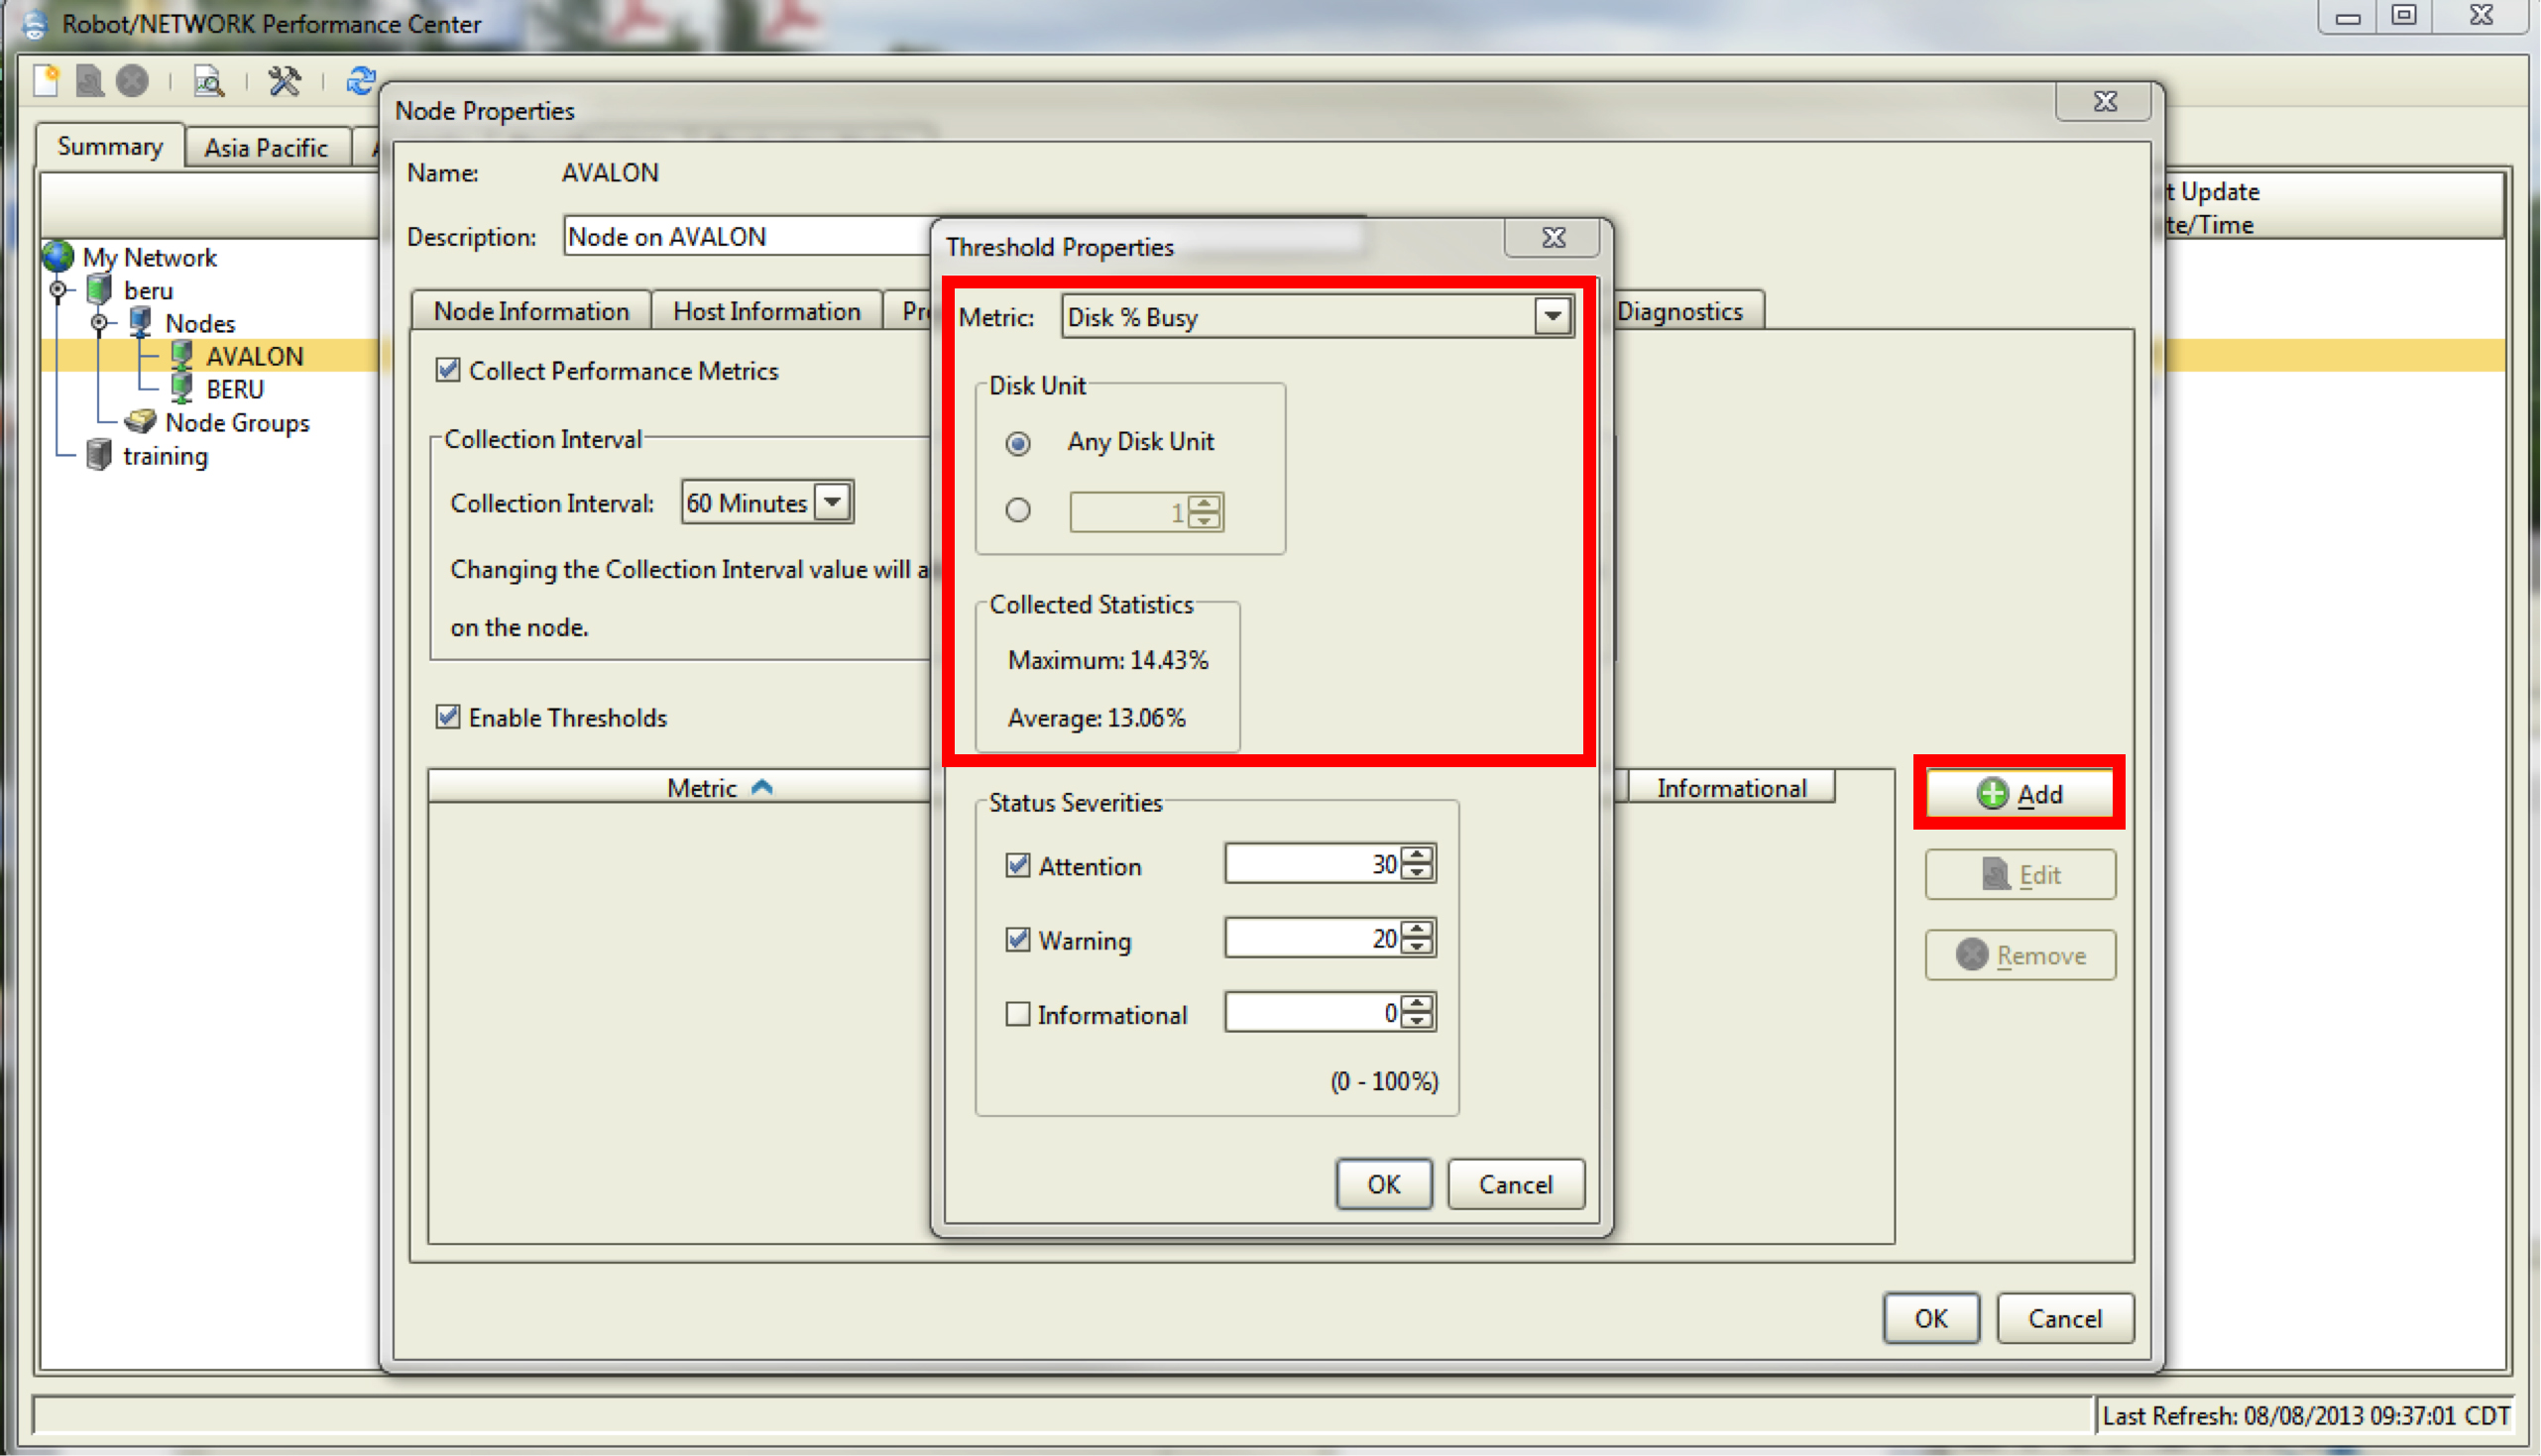
With Robot/NETWORK collecting your performance statistics, you'll have access to present and historical maximums, as well as average values, for the metrics you want—a great place to start when setting your threshold value.

Figure 2: Set threshold for “Disk % Busy” or any other performance metric.
Exceeded thresholds will automatically show up in the Robot/NETWORK Status Center (in corresponding color on the Map Center). An operator must acknowledge these messages or—if you're escalating to email via Robot/ALERT or using built-in SNMP escalation without monitoring the Status Center—you can automatically acknowledge the messages using the RBTNETLIB/RBNACK command in a scheduled job.

Figure 3: View performance exceptions for thresholds to alert your systems admin team.

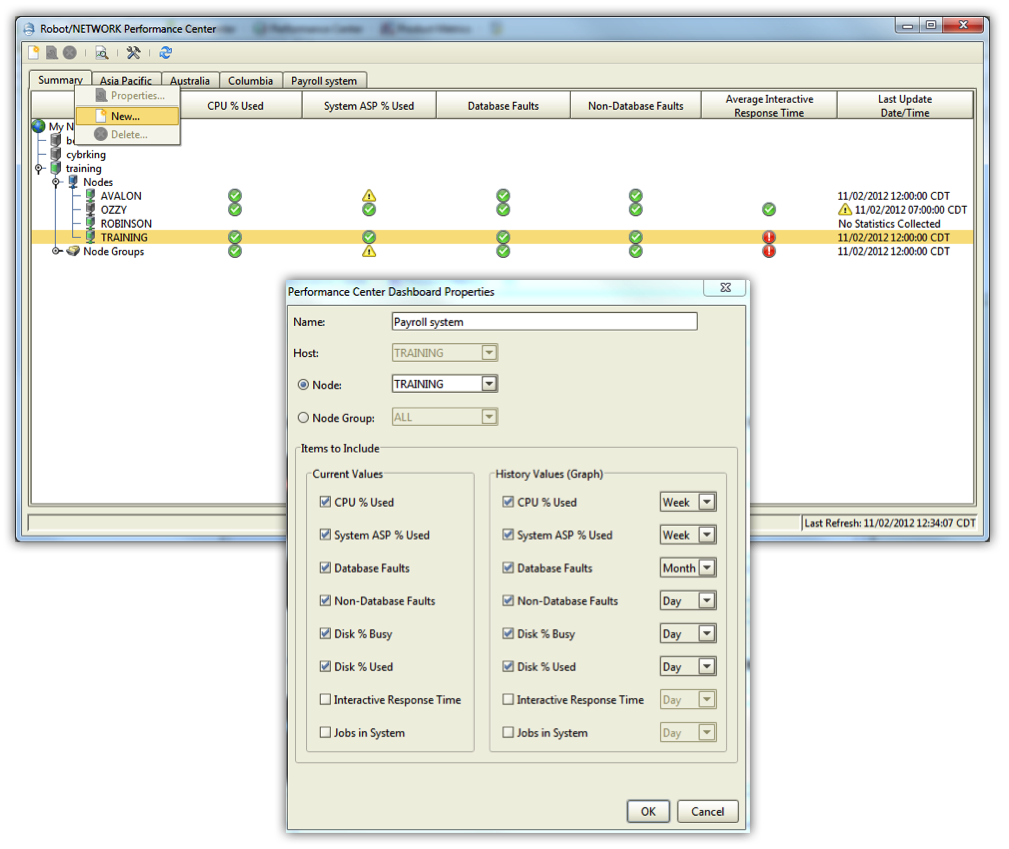
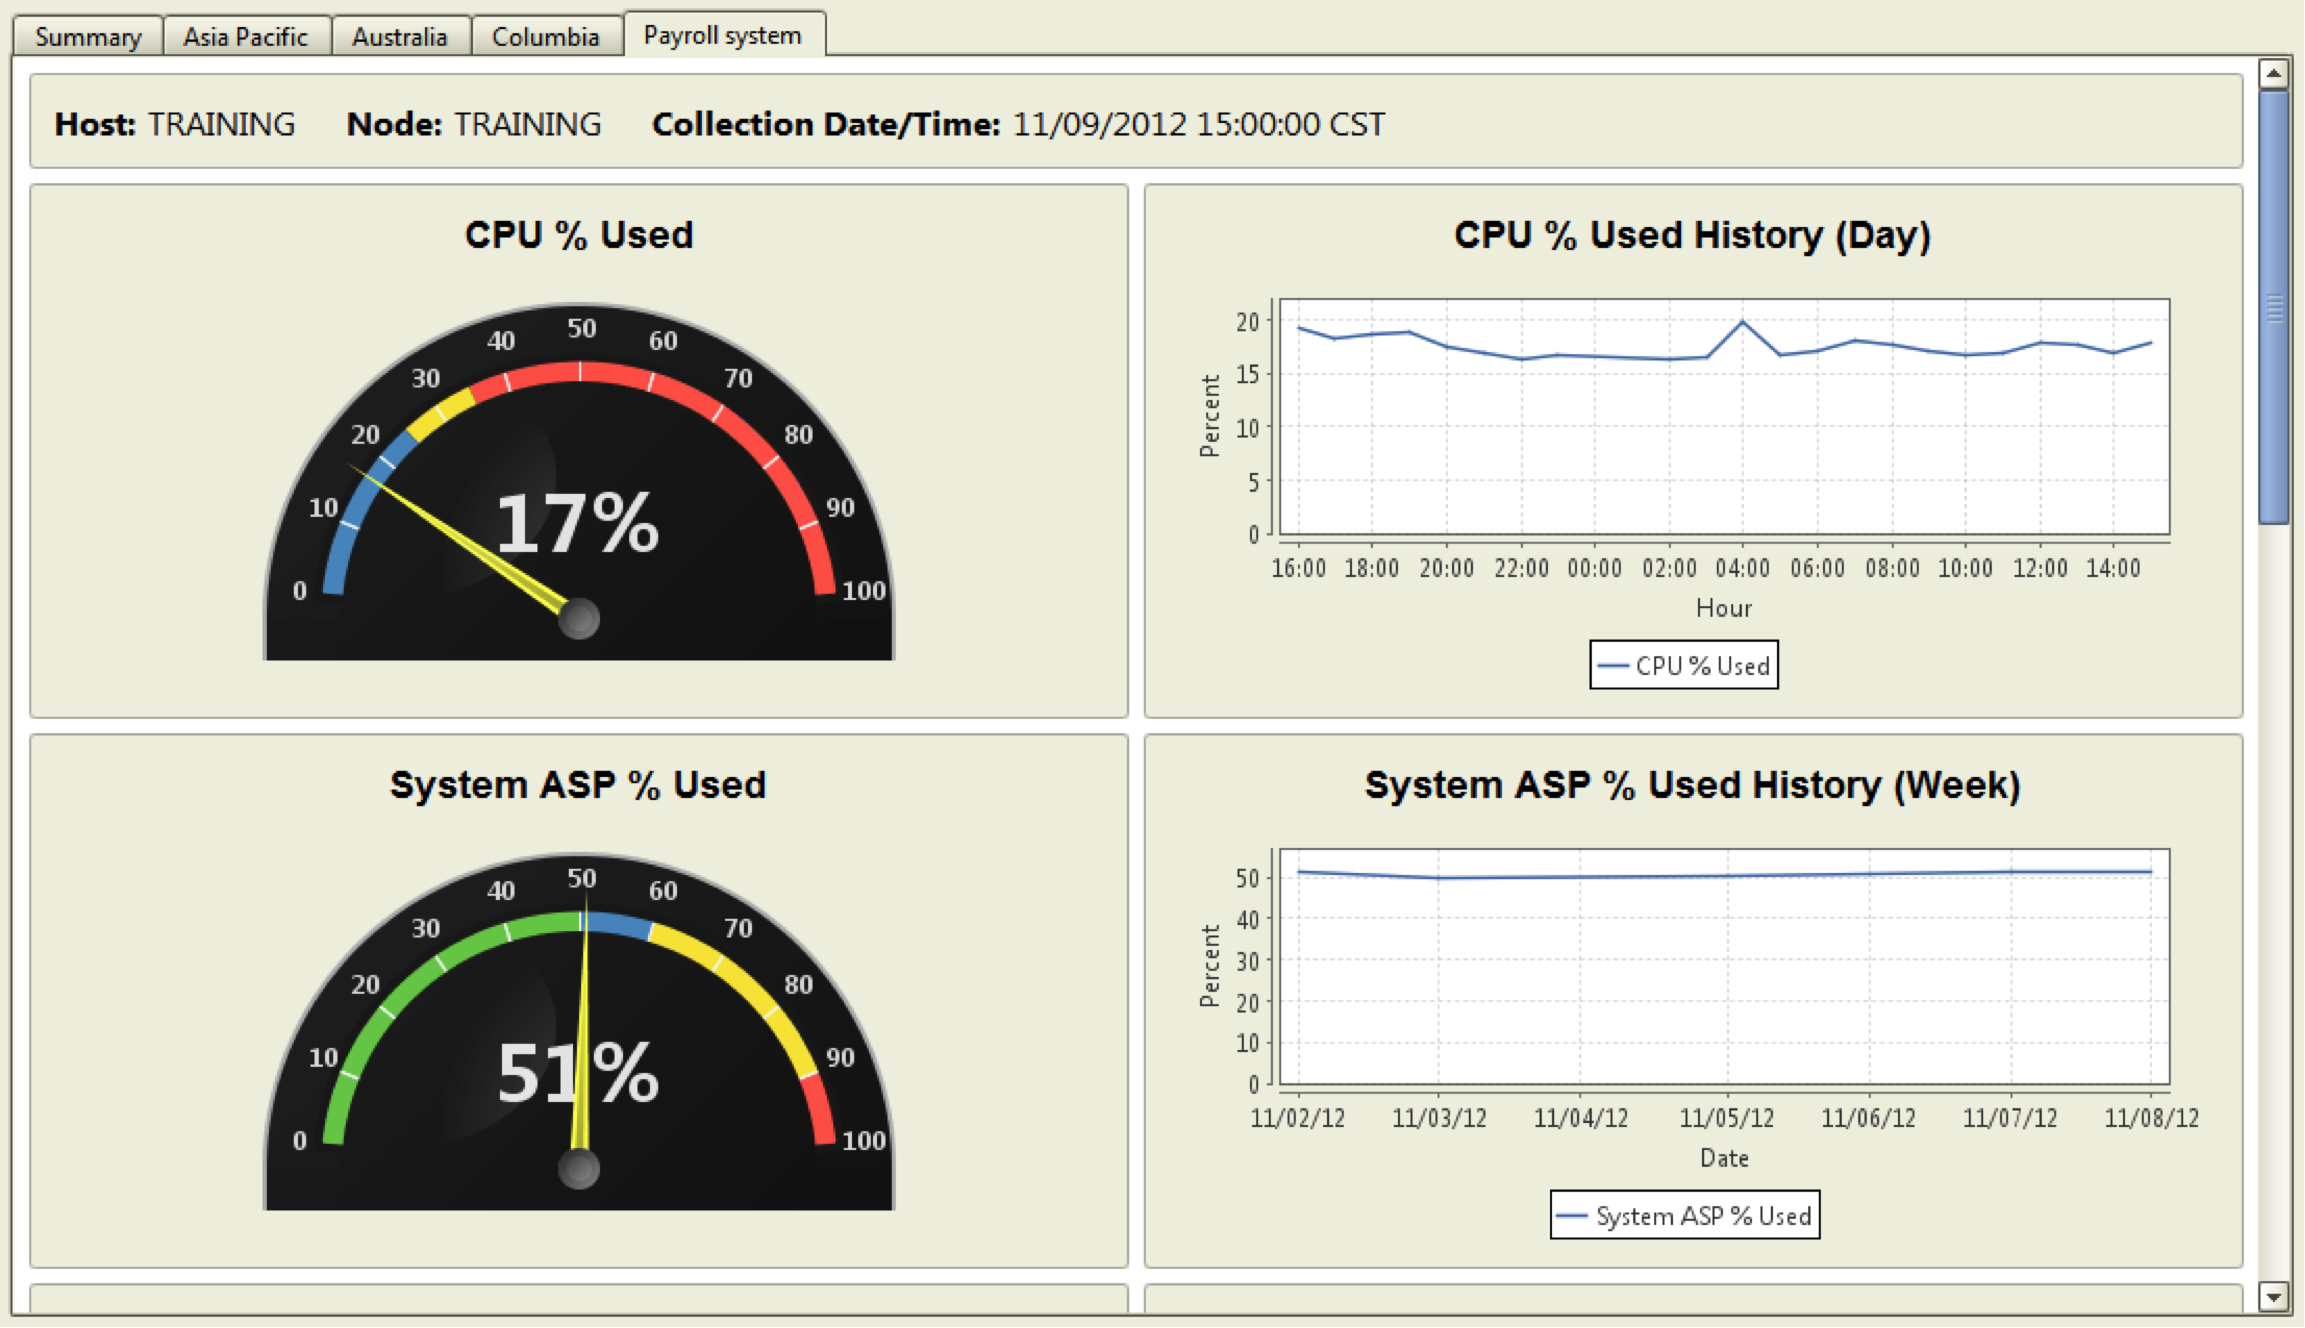
Figure 4: Create your own dashboard to view stats for one partition (as shown in Figure 5) or multiple partitions.

Figure 5: View dashboard with periodic updates.
To refine your performance monitoring even further, use the guidelines in our white paper, "Analyzing IBM i Performance Metrics", plus expect new, helpful features and functionality in the Performance Center next year. You may also experience how Robot/NETWORK will benefit your environment by setting up a free, 30-day trial. You won't regret taking this proactive approach to monitoring performance!


 More than ever, there is a demand for IT to deliver innovation. Your IBM i has been an essential part of your business operations for years. However, your organization may struggle to maintain the current system and implement new projects. The thousands of customers we've worked with and surveyed state that expectations regarding the digital footprint and vision of the company are not aligned with the current IT environment.
 TRY the one package that solves all your document design and printing challenges on all your platforms. Produce bar code labels, electronic forms, ad hoc reports, and RFID tags – without programming! MarkMagic is the only document design and print solution that combines report writing, WYSIWYG label and forms design, and conditional printing in one integrated product. Make sure your data survives when catastrophe hits. Request your trial now! Request Now.
 Forms of ransomware has been around for over 30 years, and with more and more organizations suffering attacks each year, it continues to endure. What has made ransomware such a durable threat and what is the best way to combat it? In order to prevent ransomware, organizations must first understand how it works.
 Disaster protection is vital to every business. Yet, it often consists of patched together procedures that are prone to error. From automatic backups to data encryption to media management, Robot automates the routine (yet often complex) tasks of iSeries backup and recovery, saving you time and money and making the process safer and more reliable. Automate your backups with the Robot Backup and Recovery Solution. Key features include:
 Business users want new applications now. Market and regulatory pressures require faster application updates and delivery into production. Your IBM i developers may be approaching retirement, and you see no sure way to fill their positions with experienced developers. In addition, you may be caught between maintaining your existing applications and the uncertainty of moving to something new.
 IT managers hoping to find new IBM i talent are discovering that the pool of experienced RPG programmers and operators or administrators with intimate knowledge of the operating system and the applications that run on it is small. This begs the question: How will you manage the platform that supports such a big part of your business? This guide offers strategies and software suggestions to help you plan IT staffing and resources and smooth the transition after your AS/400 talent retires. Read on to learn:
LATEST COMMENTS
MC Press Online