Giving users data in a modern, usable format helps them work more efficiently, and SEQUEL makes this happen without even leaving IBM i.
IBM i costs 45 percent less than running Linux servers and 54 percent less than Windows servers, according to a 2014 study by ITG. These calculations are based on the average cost of hardware, licenses, support, personnel, and facilities over a three-year period.
While the DB2 database on IBM i is proven to be the most cost-effective platform, some companies are still moving to or adding others. Ease of use is a major factor. Organizations need their members to work effectively, and seeing data in modern, straightforward formats improves productivity.
What these companies miss is that IBM i can do everything client databases can do—when you implement the right tools. Helping business users visualize the data they need involves three main considerations: access, usability, and understanding.
Access
For business users, believing data is easy to access is critical. SEQUEL's desktop shortcut is a simple way to get users to the data entry point.
Runtime prompts help users select the data they want to see right now. Later, they can select a different subset of information. SEQUEL provides access to vital real-time data, as well as warehoused or archived data.
What business users typically don't care about is where data is located. Data from other sources, like MS SQL Server, Oracle, MySQL, or other DB2, needs to be accessible in the same way. And if that data needs to be combined with IBM i data, there must be a way to do that. SEQUEL's power and flexibility provides results with one click.
Another requirement is getting data into the hands of business users fast. IBM i has a powerful SQL Query Engine (SQE) that allows data access requests to process quickly. SEQUEL requests can easily be directed to the SQE, so even large files return results quickly.

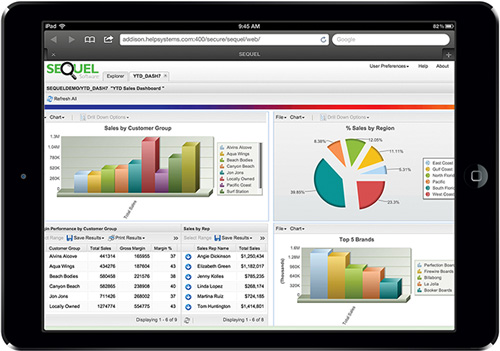
Figure 1: SEQUEL Web Interface lets users see their data from a browser.
Browsers are the ultimate access solution (Figure 1). Nothing gets installed on user PCs, and IT departments have no software to maintain. To see current information, business users simply select an address from their "favorites" menu.
Usability
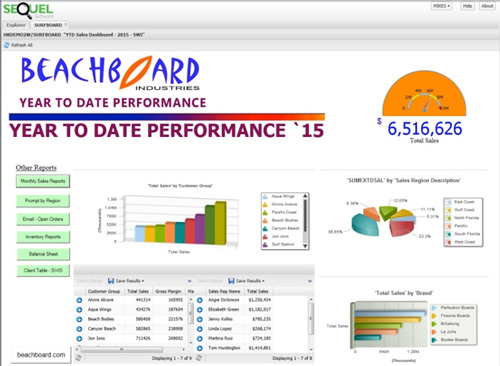
Dashboards are a simple and convenient way to visualize separate pieces of information in one location. This superstore of data can highlight different metrics that are important to the user. Choosing the right graph style can lead to new insights into the data. Gauges are a fast way to show a current value graphically. Buttons can take users to more and different data. SEQUEL lets you customize your dashboards to the needs of your business users.
When users are shown large amounts of detailed data, grasping the meaning generally comes easily. The meaning is not lost if data is presented in summary form. With SEQUEL dashboards, users can drill into summarized data to get more details, taking whatever path they choose.
For example, if conditional highlighting shows one division lagging behind in sales, an analyst can drill into the details to uncover where and why that division is behind. This dynamic drilling lets users determine the path each time they examine the results.

Figure 2: With SEQUEL, dashboards present information graphically and allow users to drill into more detailed data.
SEQUEL users can also export data to PC files, like Excel. Data displays—including dashboards—have a button for saving data to Excel, PDF, and RTF (Figure 2). Buttons on dashboards or shortcuts can be defined to automatically create PC files. SEQUEL jobs can also be scheduled to email or place PC files in a folder.
Understanding
Surprisingly, many business users don't understand what their data is telling them. Often, this is caused by misinterpreting the data presented. When everyone starts with the same definition, you see fewer misunderstandings caused by casual users tweaking data so that it displays the way they feel it should. Activity like this can leave companies with islands of mismatched data.
When you build a dashboard or a results view or table just once with SEQUEL, it's available to be used from an IBM i command line, from a PC using SEQUEL GUI software called ViewPoint, and from a browser. Everyone uses the same reports, which helps reduce the disparate data within organizations.
SEQUEL gives users easy access to data presented in a way that's useful to any organization, and it frees your IT department to address more pressing issues, like security and complex reporting needs.
Let's Get Started
Find out how visualizing data with SEQUEL can help improve efficiency and insight. Call us at 800-328-1000 or email


 More than ever, there is a demand for IT to deliver innovation. Your IBM i has been an essential part of your business operations for years. However, your organization may struggle to maintain the current system and implement new projects. The thousands of customers we've worked with and surveyed state that expectations regarding the digital footprint and vision of the company are not aligned with the current IT environment.
 TRY the one package that solves all your document design and printing challenges on all your platforms. Produce bar code labels, electronic forms, ad hoc reports, and RFID tags – without programming! MarkMagic is the only document design and print solution that combines report writing, WYSIWYG label and forms design, and conditional printing in one integrated product. Make sure your data survives when catastrophe hits. Request your trial now! Request Now.
 Forms of ransomware has been around for over 30 years, and with more and more organizations suffering attacks each year, it continues to endure. What has made ransomware such a durable threat and what is the best way to combat it? In order to prevent ransomware, organizations must first understand how it works.
 Disaster protection is vital to every business. Yet, it often consists of patched together procedures that are prone to error. From automatic backups to data encryption to media management, Robot automates the routine (yet often complex) tasks of iSeries backup and recovery, saving you time and money and making the process safer and more reliable. Automate your backups with the Robot Backup and Recovery Solution. Key features include:
 Business users want new applications now. Market and regulatory pressures require faster application updates and delivery into production. Your IBM i developers may be approaching retirement, and you see no sure way to fill their positions with experienced developers. In addition, you may be caught between maintaining your existing applications and the uncertainty of moving to something new.
 IT managers hoping to find new IBM i talent are discovering that the pool of experienced RPG programmers and operators or administrators with intimate knowledge of the operating system and the applications that run on it is small. This begs the question: How will you manage the platform that supports such a big part of your business? This guide offers strategies and software suggestions to help you plan IT staffing and resources and smooth the transition after your AS/400 talent retires. Read on to learn:
LATEST COMMENTS
MC Press Online