Included with OS/400 V4R5 is a new version of AS/400 Client Access Express for Windows (V4R5M0). With this latest version of IBM’s PC connectivity product are a number of enhancements to the AS/400 Operations Navigator (OpsNav). I will take a brief look at those enhancements.
As you look at some of the new pieces of GUI in OpsNav V4R5, you’ll see some examples of the user-interface strategy that IBM now has in place. OpsNav is becoming more visual than ever before, going well beyond an icons-only GUI to the use of graphics for showing relationships between complex objects. In addition, IBM continues to focus on ease of use by providing wizards that guide users through complex or infrequently done tasks.
Diagrams Explain SQL Statements
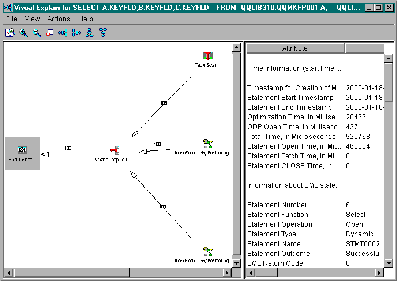
A major enhancement in OpsNav’s database GUI is the function called Visual Explain, a tool for database programmers and administrators who need to understand and tune query performance (see Figure 1). Visual Explain makes it easy to see the steps involved in SQL statement execution and to understand the costs involved, including the processing time and the number of records retrieved for each step. Visual Explain does this by creating a diagram of SQL statement execution on the AS/400.
The icons in the diagram (Figure 1) represent operations and the results of operations when an SQL statement runs. Arrows are used to show the order in which the steps are executed. A summary, with detailed information, is available for each icon in the diagram; summary information comes in a pop-up box as you drag your mouse over the icons. When you click on an icon, the right pane of the Visual Explain window shows you detailed information about it. And Visual Explain comes with some neat options for customizing the size and style of the diagram.
You can run Visual Explain either on performance data you’ve collected or on an SQL statement directly. If you’ve created a detailed SQL performance monitor in OpsNav, you can right-click on that monitor and take the List Explainable Statements menu option. This results in a dialog box, showing all of the SQL statements for which performance data were collected; you can select a statement and run Visual Explain for it. If you want to use Visual Explain on an SQL statement directly, you can use the SQL Script editor (available by right-clicking on the Database icon and selecting Run SQL Scripts).
The SQL Script editor, first available in OpsNav V4R4, is a great environment for writing and testing SQL statements; for V4R5, it includes two different ways to use Visual Explain. A Run and Explain option first runs the SQL statement, collects the data on it, and displays it with Visual Explain. The Visual Explain only option displays the query and some useful information about it, but the statement never actually executes on the AS/400. The Run and Explain option takes more time to generate the Visual Explain diagram, since the SQL statement has to be run; however, it provides the most complete and accurate information.
More Detailed Information for Tables and SQL
Other enhancements to OpsNav make it easier to understand and debug database operations. There’s a new menu option on tables, Locked Rows, which shows you the table rows that are locked, the jobs with the locks, and the SQL statements locking the rows. You can also view the job log for the locking job or end the job.
Another new table menu option is Table Description, which provides detailed information about a table stored on the AS/400. This information is similar to what’s available today with the Display File Description (DSPFD) command. And finally, Current SQL For A Job is a new menu option on the database folder that allows you to view the SQL being executed by a job.
Disk Management: OpsNav Brings It Together
OS/400 includes a number of green-screens that provide the information needed to work with disk units. This green-screen user interface is spread among different panels, forcing the user to move from screen to screen to accomplish tasks. And as AS/400s are now providing more storage, there will be systems with hundreds, maybe even thousands, of individual disk units. Scrolling through hundreds of disk units on a green-screen that has a scrollable area of a dozen or so units can make disk management awkward, if not outright difficult.
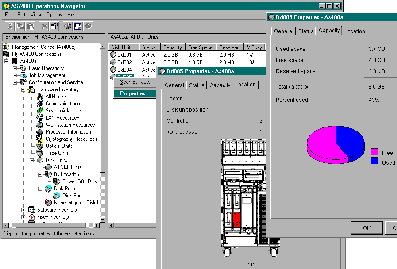
The solution to these problems is OpsNav’s new Disk Management GUI (see Figure 2). The Hardware Inventory folder, under Configuration and Service, has been extended to include the Disk Units subfolder. For convenience, the Disk Unit subtree offers several views of the units in its subfolders: you can view them all in one list or view them by physical location in towers or view them by disk pools (auxiliary storage pools). The Properties option for individual disk units includes status and capacity information for that unit; clicking on the properties’ Location tab reveals a surprise: a graphic of the tower, with a highlighted area showing the exact location of the drive in the rack. There’s even a subfolder for nonconfigured disk units, which can be added to your system with the assistance of the Add Disk Unit wizard. This wizard takes you step-by-step through the process of adding a disk unit. It even offers to balance the storage in the disk pool after the new unit is added. Other tasks supported in the disk management GUI include scanning the surface of a disk for errors and clearing or formatting nonconfigured disks.
Since OpsNav provides powerful capabilities with this disk-management GUI, users must have service authority or a security administrator must use Application Administration to enable them to see the disk-management GUI. The application administration information for disk-units access is not listed with the other OpsNav functions; instead it’s under Host Applications. Right-click on the AS/400 icon and take the Application Administration menu option. Click on the Host Applications tab to switch from administering access to OpsNav to administering access to host applications. From there, you expand the function tree to Operating System/Service; then select DiskUnits and push the Customize button to bring up the dialog box that allows you to control access to the disk-unit GUI. (You can also allow access to individual users or groups via the Capabilities push button in their properties.)
INS Windows Server Management
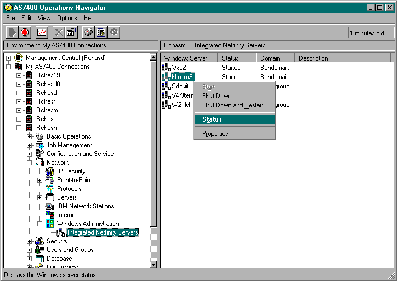
As shown in Figure 3, OpsNav’s Network folder now includes a Windows Administration subfolder, which contains a subfolder of individual Integrated Netfinity Servers (INSs) on the AS/400. The list of servers includes status and descriptive information. The GUI allows you to start or shutdown your INS. You can also request a detailed status on a server, which shows you the number of connected users and the INS processor, paging, and registry quota utilization for a running server. If the INS is not started, the status dialog allows you to view system operator messages in the event that the server may have logged any messages there. Additional INS GUI functions include the ability to work with individual server properties, such as where to log messages from the server.
A Continuing Evolution
As you can see, Operations Navigator continues to grow and encompass more OS/400 functions in its GUI. But there’s a subtle evolution occurring, too, as IBM focuses on advanced presentations, like disk unit locations and Visual Explain’s diagrams, and wizards. In its next release, you’ll see much more OS/400 coverage, more advanced visual presentations, and more configuration and setup wizards—all aimed at providing an easy- to-use, well-integrated, and productive user interface to OS/400.

Figure 1: Use Visual Explain to tune your SQL queries.

Figure 2: This is the new, easy-to-use DASD management interface for OpsNav.

Figure 3: Integrated Netfinity Server management is easy with OpsNav.


 Business users want new applications now. Market and regulatory pressures require faster application updates and delivery into production. Your IBM i developers may be approaching retirement, and you see no sure way to fill their positions with experienced developers. In addition, you may be caught between maintaining your existing applications and the uncertainty of moving to something new.
 IT managers hoping to find new IBM i talent are discovering that the pool of experienced RPG programmers and operators or administrators with intimate knowledge of the operating system and the applications that run on it is small. This begs the question: How will you manage the platform that supports such a big part of your business? This guide offers strategies and software suggestions to help you plan IT staffing and resources and smooth the transition after your AS/400 talent retires. Read on to learn:
LATEST COMMENTS
MC Press Online