


Did you really think that you didn't have to worry about this if you're a Java developer?
Java provides developers with false assurance that memory leakage is something they need not be concerned with. Even with Java Garbage Collection, leaks may occur. And further complicating the issue, OS memory usage may be stable while the JVMs fluctuate.
The challenge is in detecting that there are leaks and then determining where they are located. There are so many places where memory could be leaking that it is non-trivial to manually check them all.
With AutoPilot Heap Detective, you can rapidly diagnose your memory leaks. This free application provides diagnostics to find the top offenders and simplify the task of determining the cause of these Java memory leaks. Heap Detective gathers all memory usage information for you in a straightforward interface in order to pinpoint your leaks. Heap Detective finds all objects in heap, capturing instance count, total size, and average size. It reports on top objects by retained size to find the likely culprits.
The typical types of leaks that Heap Detective can be applied to include these:
- Out of Memory
- Increased GC activity
- Heap Usage
- Thread Leaks, Handle Leaks: Applications are spawning threads, and these threads are not properly shutting down, resulting in leaks.
- JDBC Prepared Statements: Even though the objects are being garbage-collected, it doesn't necessarily mean that the resources allocated by the underlying databases are being deallocated. Typically, you will find that the application developers are not properly closing the prepared statements.
- Class Loader Leaks: Class loader leaks are very difficult to spot, but they do happen, especially when redeploying applications or when working with applications with custom class loaders.
Regardless of the reasons for these leaks, dealing with composite applications and multiple moving parts can be a real challenge in application development and production support. Due to the complexity, it is often impossible to spot the resource or component systems that are exhibiting leak behavior.
Here's a list of features:
- Gathers detailed memory usage
- Analyzes JVM heap remotely on any running JVM without generating a heap dump
- Forces Garbage Collection remotely
- Shows JVM summary: Java properties, heap usage, and free memory
- Drills down to areas where memory is used by Instance Count, Retained Size, and Shallow Size
- Drills down to what objects hold references to top memory consumers
- Takes and compares multiple heap snapshots
AutoPilot Heap Detective doesn't use the Java resources it is diagnosing. It's written in C/C++ and thus doesn't use Java Heap.
This production-ready app doesn't run continuously; it takes snapshots. And it doesn't impact Java application performance.
With remote inspection of Java memory, there's no need for colocation of the tool with the JVM.
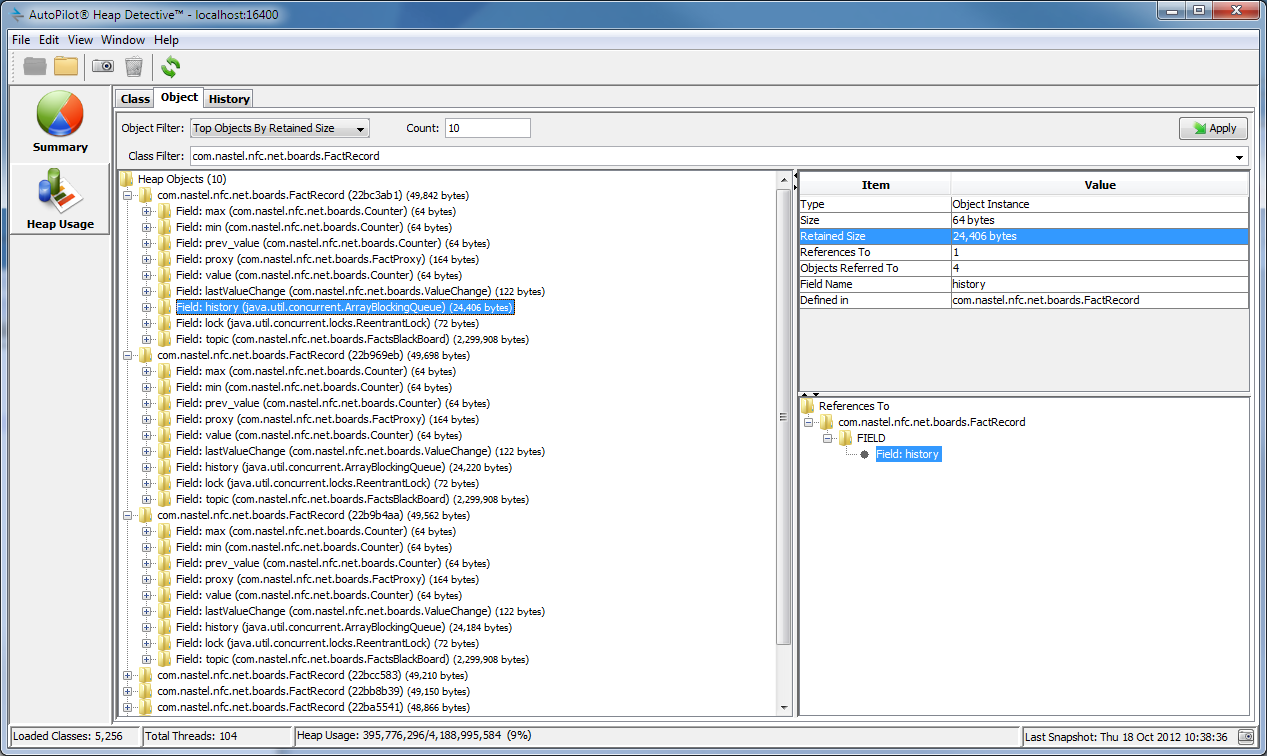
Figure 1: This report shows a historical view of heap with the total size of each object. The report is sorted by the largest absolute change.
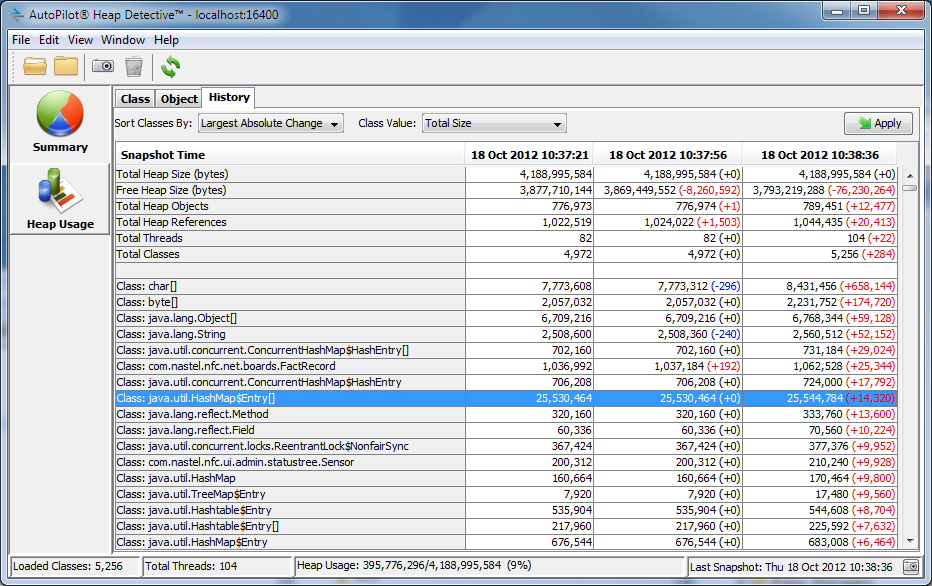
Figure 2: This view shows the "top objects by retained size" within heap. A user can interact with this view and highlight a heap object, see its properties such as retained size, the fields it is comprised of, and all the references it has to objects within the JVM.
There's an optional upgrade path for Heap Detective to enable leak detection as well as leak diagnostics. Integrating Heap Detective with Nastel AutoPilot provides analysis, diagnostics, and alerting as part of an application performance monitoring solution.
But Wait! There's More!
Nastel also offers another free product, MQSonar, that performs as a "ping" for WebSphere MQ. Download AutoPilot for MQSonar for free.
 Business users want new applications now. Market and regulatory pressures require faster application updates and delivery into production. Your IBM i developers may be approaching retirement, and you see no sure way to fill their positions with experienced developers. In addition, you may be caught between maintaining your existing applications and the uncertainty of moving to something new.
 IT managers hoping to find new IBM i talent are discovering that the pool of experienced RPG programmers and operators or administrators with intimate knowledge of the operating system and the applications that run on it is small. This begs the question: How will you manage the platform that supports such a big part of your business? This guide offers strategies and software suggestions to help you plan IT staffing and resources and smooth the transition after your AS/400 talent retires. Read on to learn:
LATEST COMMENTS
MC Press Online