When you make changes to autoreplies in QMessage Monitor, Analyze is the must-use functionality. But what if new autoreplies don't work as intended? Meet Reply Trace, a powerful new feature that illuminates autoreply issues for fast investigations.
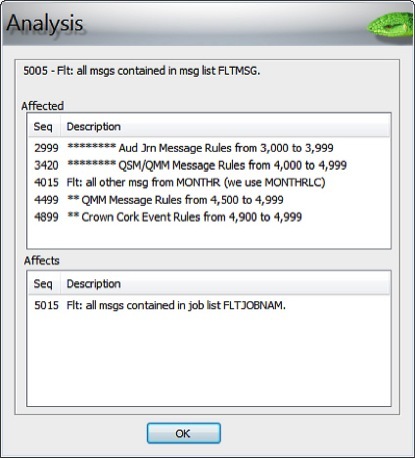
Existing QMessage Monitor (QMM) users will know it is best practice to use the Analyze function after changing or adding autoreplies. Available in the PC module Maintenance by right-clicking an autoreply, the Analyze function checks which autoreplies share the same message ID with the currently selected autoreply. When matches are found, a list is generated that is split into two categories— "Affected" and "Affects"—as shown in Figure 1 below.

Figure 1: The Analyze tool checks whether an autoreply interferes with other autoreplies.
The Analyze feature is now keeping company with a new function called Reply Trace, which offers users extended capabilities for managing autoreplies.
When a message is picked up by QMM from one of the monitored message queues, QMM tries to match it against each of the configured autoreplies, comparing the message's properties (e.g., ID, severity, job name, field values, etc.) against the criteria specified on the autoreply. It repeats this process until it finds the first autoreply that matches the message. Then, it performs the action specified on the autoreply (e.g., Log Option and escalation). At this point, the matching typically stops, unless the autoreply is set to "Continue from…".
So where does Reply Trace come in? Reply Trace allows you to record and view all those steps. If you turn on Reply Trace, you get a list of the autoreplies QMM went through before hitting on the right one for each message. For those autoreplies that were tested but found not to be a match, QMM records the reason why. For example, the message was CPF1234, but the autoreply specified CPF5678, giving system admins visibility into the reasoning. Reply Trace also shows you which actions the autoreply performed that were eventually matched.
It helps to think of each autoreply as a simple if-then statement in a program: all autoreplies taken together constitute one large program made up of lots of if-then statements. Reply Trace allows you to view each step in autoreply processing and to debug your autoreplies.
The main reason to use Reply Trace is if your autoreplies are not working as expected.
Step 1: Configuration
On your host system, go to QMM and choose Option 1 to enter the QMM maintenance. Press F8 to enter the defaults. Under Message Reply Trace, set Maximum File Size to 64 (megabytes). Push Enter to return to the list of systems. Select Option 1 for the system where you want to enable Reply Trace. Then, set every field in the Message Reply Trace section to "Y" as shown below.

Figure 2: As usual, the value in cyan, with the dotted underline, stands for the default value, which you can override.
Hit Enter, then F10 to display the status screen. End monitoring for the queue on which the message will be received. Hit F5 until you see the queue as "Not active." Then start monitoring for the queue again.
Step 2: Send a Test Message
Test your autoreplies by sending a test message (using MMSNDMSG, for example) or wait for your test message to occur "naturally" via an application.
Step 3: Look Under the Cover of QMM Message Processing
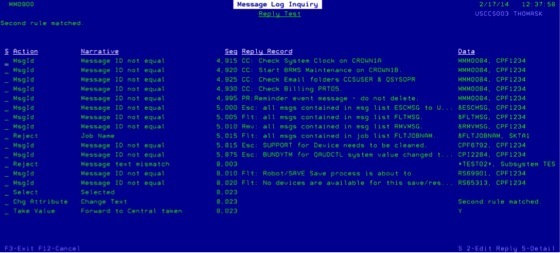
Use the MMLOGINQ command on your host to enter the Message Log Inquiry and search for the test message. Specify the message ID, system, current date, and anything else that will help you identify the message in the Activity Log, and press Enter. On the results list, locate the test message. Then select option "H" for History. As a result, you will see the Reply Trace.

Figure 3: Message Log Inquiry displays the Reply Trace.
In this example, you see "Message ID not equal" repeatedly, which represents autoreplies that were not matched. Toward the end, you finally see "Selected," which is a successful match. You can even look at the details of each step with Option 5 or edit the autoreplies from this screen with Option 2.
Reply Trace won't fill up your disk as the maximum file size is specified in Step 1. When the limit is reached, the oldest entries in the trace are discarded. For fast systems with low CPU and disk utilization, Reply Trace can run in the background. Otherwise, we recommend that you turn it off after your debugging session. Just set the values that you set to "Y" in the first step to the defaults by blanking out each "Y."
The next time your autoreplies are giving you grief, think about adding the QMessage Monitor solution to streamline your processes. Try it free for 30 days!


 Business users want new applications now. Market and regulatory pressures require faster application updates and delivery into production. Your IBM i developers may be approaching retirement, and you see no sure way to fill their positions with experienced developers. In addition, you may be caught between maintaining your existing applications and the uncertainty of moving to something new.
 IT managers hoping to find new IBM i talent are discovering that the pool of experienced RPG programmers and operators or administrators with intimate knowledge of the operating system and the applications that run on it is small. This begs the question: How will you manage the platform that supports such a big part of your business? This guide offers strategies and software suggestions to help you plan IT staffing and resources and smooth the transition after your AS/400 talent retires. Read on to learn:
LATEST COMMENTS
MC Press Online