Now that you have your feet wet with IBM Director for System i, it's time to dive into the deep end on the powerful aspect of using its resource monitors to manage your network resources.
This article takes you through the use of resource monitors in IBM Director. This is the most exciting function for our customers. Monitoring various aspects of your resources and taking automated actions based on those monitors helps make system management easier, thus reducing cost and downtime.
What might, at first glance, appear to be a complicated task of setting up monitors is really as simple as 1, 2, 3:
- What to monitor
- When to take action
- What actions to take
Step 1: What to Monitor
To get started, from the main IBM Director console pane shown in Figure 1 below, you can drag the Resource Monitors task to the system you want to monitor.
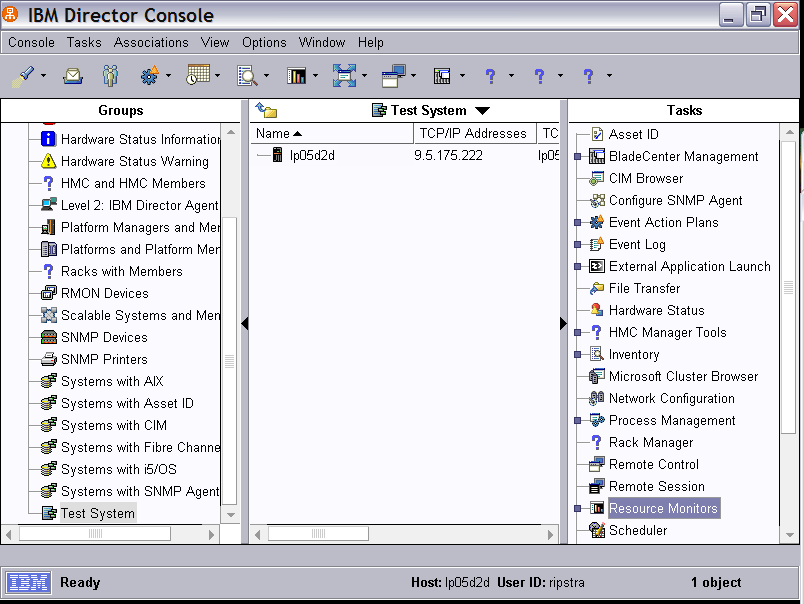
Figure 1: This is the main IBM Director Console pane. (Click images to enlarge.)
This will bring up the pane in Figure 2. By expanding Director Agent, i5/OS System Monitors, and System Statistics, you can see that several things can be automatically monitored right out of the box for a system running i5/OS. In this example, you double-click on System ASP Used %, which will cause it to be selected and propagated to the right side. In this case, the current state of DASD usage is shown as 22%. By right-clicking and selecting Individual Threshold, you will see the pane as shown in Figure 3.
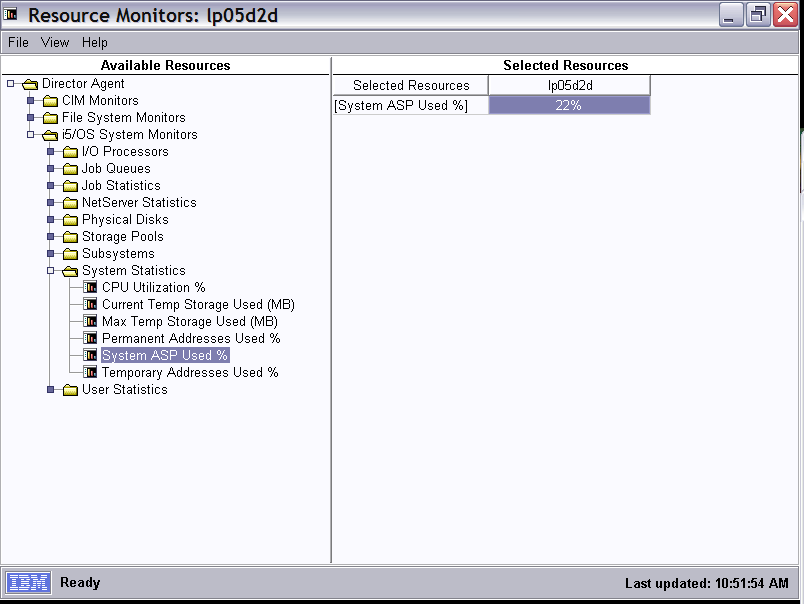
Figure 2: Expand the Resource Monitor pane.
Step 2: When to Take Action
By setting up a threshold for DASD usage, you are indicating that an event is to be signaled when the DASD usage is above 50% (by specifying 50 in the field labeled Above Or Equal). Note that you can set a critical threshold as well as warning, normal, and low errors. These can all trigger different events that can be handled separately with different action plans.
In the example shown in Figure 3, the threshold has been set to 50%, and it will be monitored every five minutes with an event triggered every two minutes.
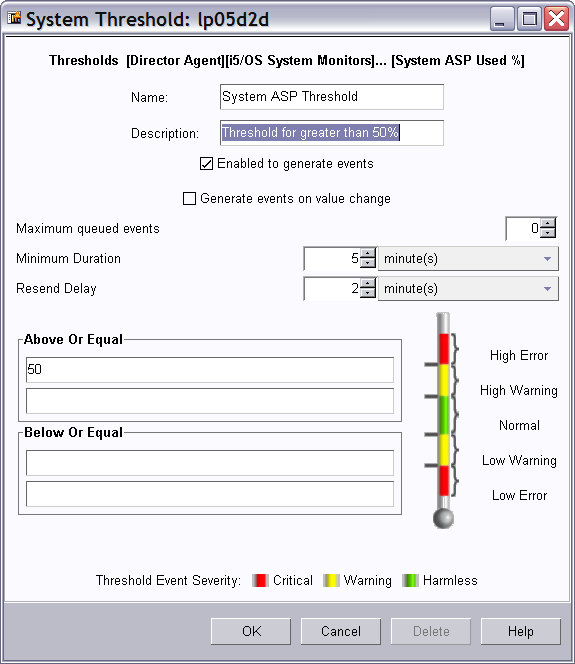
Figure 3: The threshold is set for 50% DASD usage.
Press OK, and then on the previous panel, select "Save as..." and name it "Resource Monitor for 50% DASD".
Step 3: What Actions to Take
Many installations of System i have procedures that are used when DASD usage becomes a problem—for example, cleaning up job logs and output queues or moving little-used objects to offline storage. In this example, assume that those procedures are gathered under a single CL program called qgpl/mycleanup. This can be set up as a task by right-clicking Process Tasks (Figure 4) and creating a new task as shown in Figure 5.
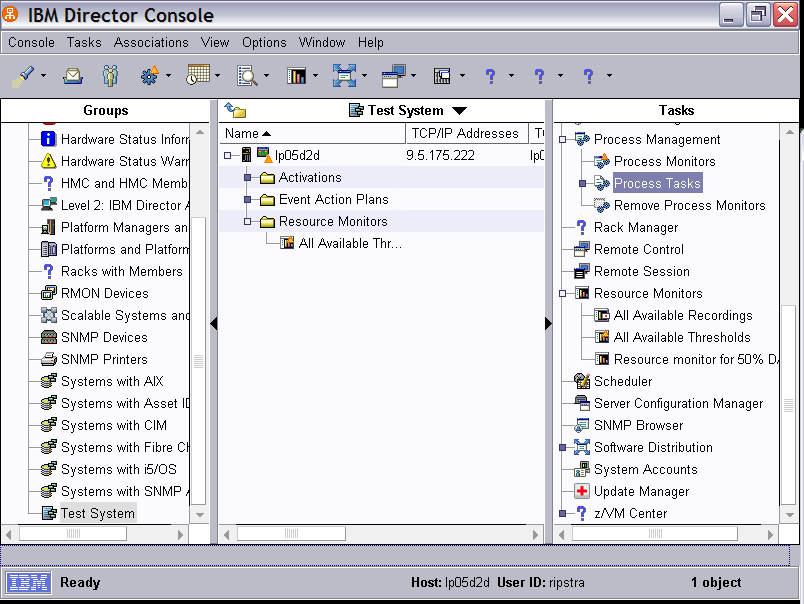
Figure 4: Create a process task.
Process tasks are simple commands that are issued from qsh. By using the command system "call qgpl/mycleanup", a call is made to mycleanup program in qgpl. It must be in quotes and be proceeded by "system" since it is run from qsh. You will need to specify a user profile and password that are to be used when the task is run. Save this with the name "Do my system cleanup" (Figure 5). This task can be run manually by simply dragging it across to one of your System i machines, which allows for verifying that it is set up correctly.
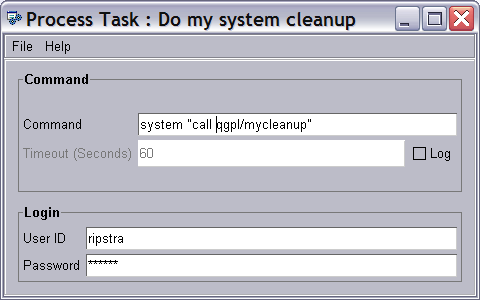
Figure 5: Set up a process task.
From the main IBM Director console panel, select Tasks -> Event Action Plans -> Event Action Plan Builder. Figure 6 will be displayed so that you can create a unique action plan that decides what events to take action on and what actions to take.
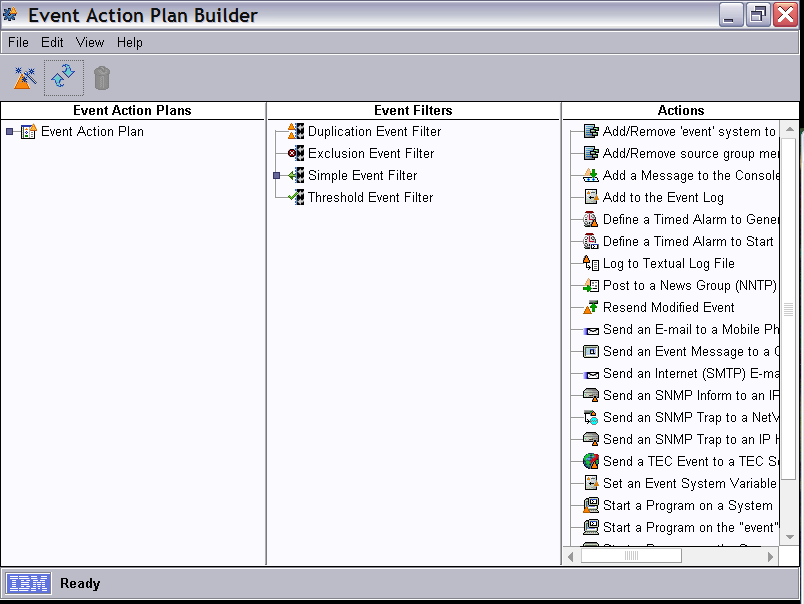
Figure 6: The Event Action Plan Builder determines what events to take action on and what actions to take.
Note that there is an additional step to set up the process task created above as an event action to be taken when an event occurs (in this case, DASD usage goes above 50%). To make this into an event action, right-click on Start a Task on the Event System (Figure 7). The panel in Figure 8 will be displayed after selecting the Do My System Cleanup task.
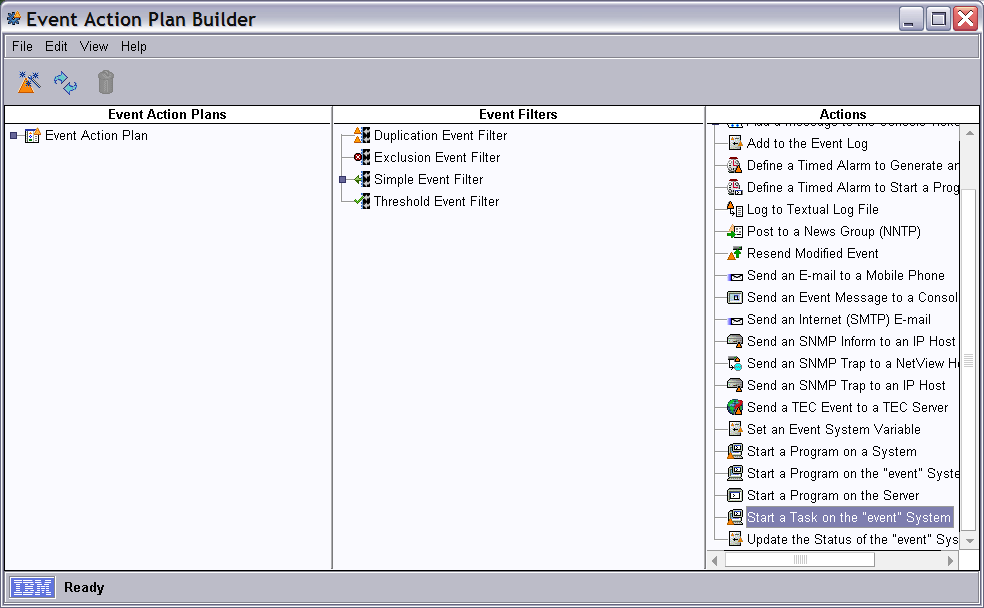
Figure 7: Create an action based on a task.
Save this as Event Action for Cleanup.
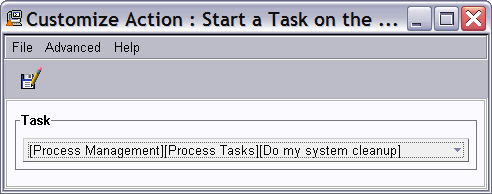
Figure 8: Create the action for a task.
Putting It All Together
Now, all you have to do is put it all together and you have an action plan. First, you need to create a new action plan by right-clicking on Event Action Plan and selecting Create. In this case, it's called Action Plan for 50% DASD.
Next is to determine the "when" portion of the event action plan. The simplest way I have found for this is to drag the All Events event filter and drop it on the action plan that you just created, as in Figure 9.

Figure 9: Determine the event to take action on.
The next step is to determine what will be done for the event action plan when the event occurs. In this example, you will choose to notify all of the IBM Director administrators currently logged on to the server with a ticker-tape message with the system name and a message. This is created by right-clicking the Add a Message to the Console action in the right pane (Figure 10) and specifying the text of the message along with substitution text of &system, which will be replaced by the system name of the resource for which the event occurred. That allows this action plan to be used for any System i resource. Specifying * in the User(s) field will cause the message to be displayed to all administrators currently logged on.
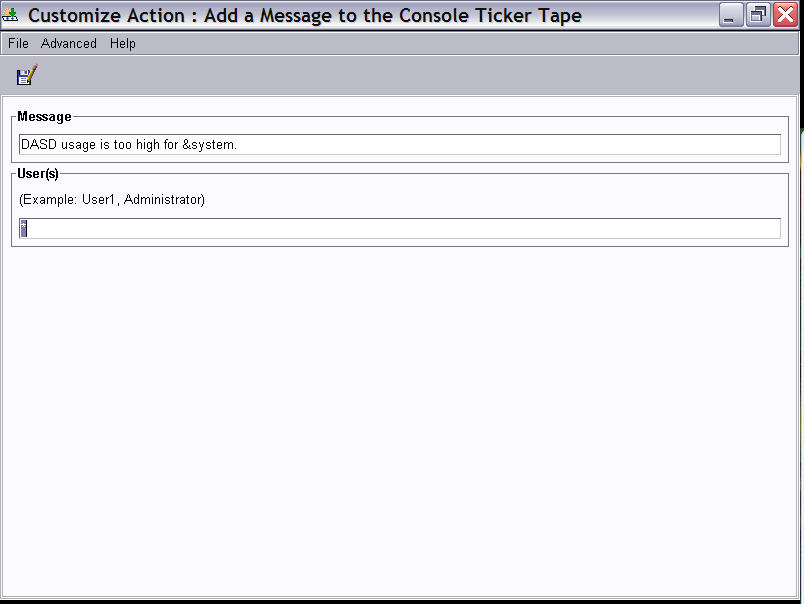
Figure 10: Create a customized ticker-tape message for 50% DASD usage.
By dragging both the new ticker-tape message and the event action for cleanup (Figure 11) to the Event Action Plan, you ensure that the system will take those two actions when the event is triggered.
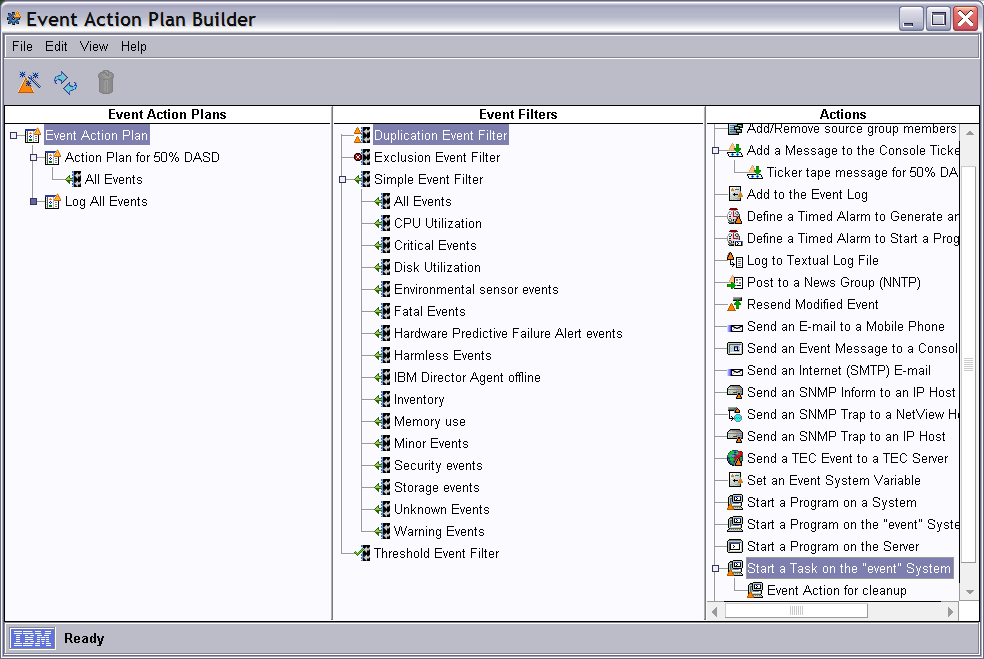
Figure 11: Put it all together.
To use the event action plan, go to the IBM Director Console and simply drag the action plan from the Task list to the system or group of systems that you want to take action on. Note that the resource monitor must be running. This is what causes the events to be signaled. The event action plan is what takes action based on those events.
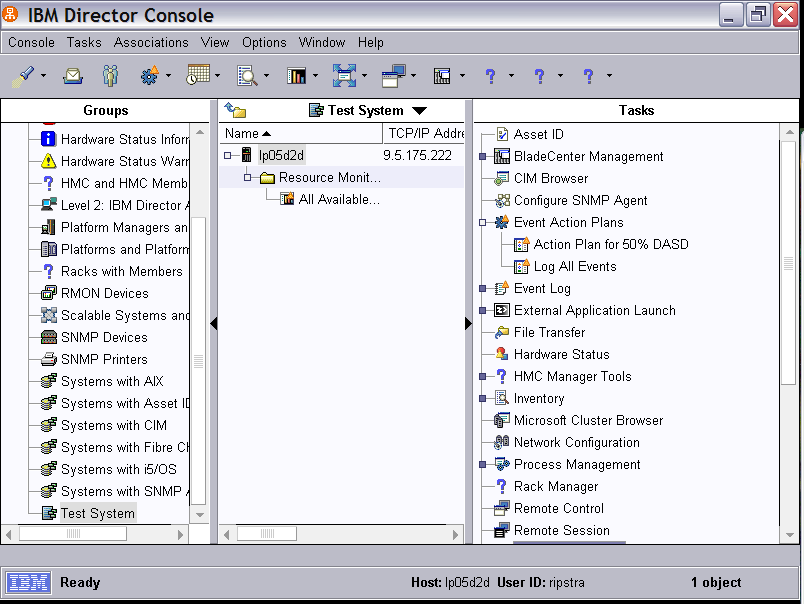
Figure 12: Use the action plan.
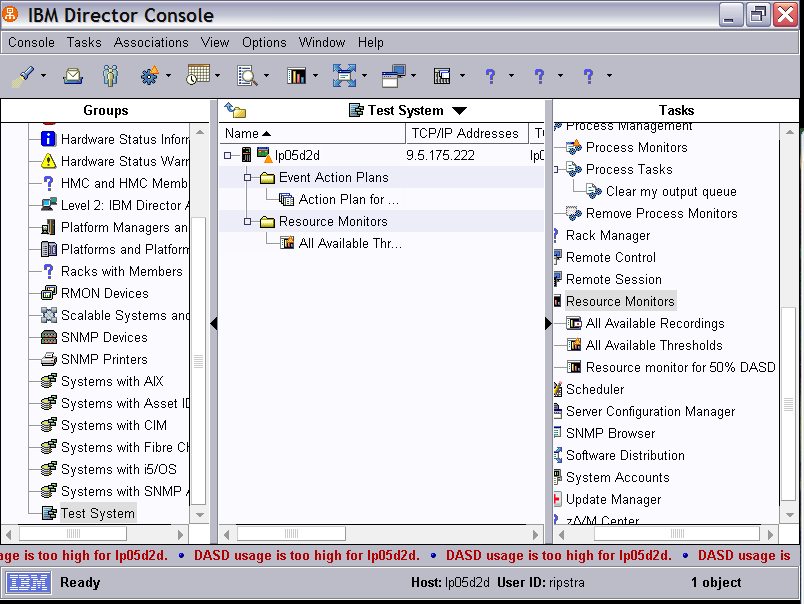
Figure 13: An event is fired, an action is taken, and the user is notified.
For this example, when the DASD usage goes about 50%, an event is triggered (and logged), the action plan sends a message to the console indicating the DASD usage is too high for the system (Figure 13), and the cleanup is performed.
It's as simple as 1, 2, 3.
John Ripstra is a Software Engineer for IBM in Rochester with over 27 years of experience with midrange systems. He currently works on IBM Director for System i and can be reached at


 Business users want new applications now. Market and regulatory pressures require faster application updates and delivery into production. Your IBM i developers may be approaching retirement, and you see no sure way to fill their positions with experienced developers. In addition, you may be caught between maintaining your existing applications and the uncertainty of moving to something new.
 IT managers hoping to find new IBM i talent are discovering that the pool of experienced RPG programmers and operators or administrators with intimate knowledge of the operating system and the applications that run on it is small. This begs the question: How will you manage the platform that supports such a big part of your business? This guide offers strategies and software suggestions to help you plan IT staffing and resources and smooth the transition after your AS/400 talent retires. Read on to learn:
LATEST COMMENTS
MC Press Online