Did you know DB2 Web Query has output options to send your reports directly to Excel? Learn about some of the tool's features that will help you easily and quickly build Excel spreadsheets.
In part 1 of this series, "TechTip: DB2 Web Query and Excel Spreadsheets: Easy as Pie!, Part I," I provided an introduction on the basic DB2 Web Query output options to Excel spreadsheets. In this TechTip, I expand upon those capabilities and show you how to take advantage of Excel's multiple worksheet capability by using the following DB2 Web Query features: table of contents and compound documents.
Table of Contents
In the previous TechTip, we activated features such as Sort Across and Stack Measures to pack quite a bit of information into the spreadsheet. The sample output of that spreadsheet is shown in Figure 1.
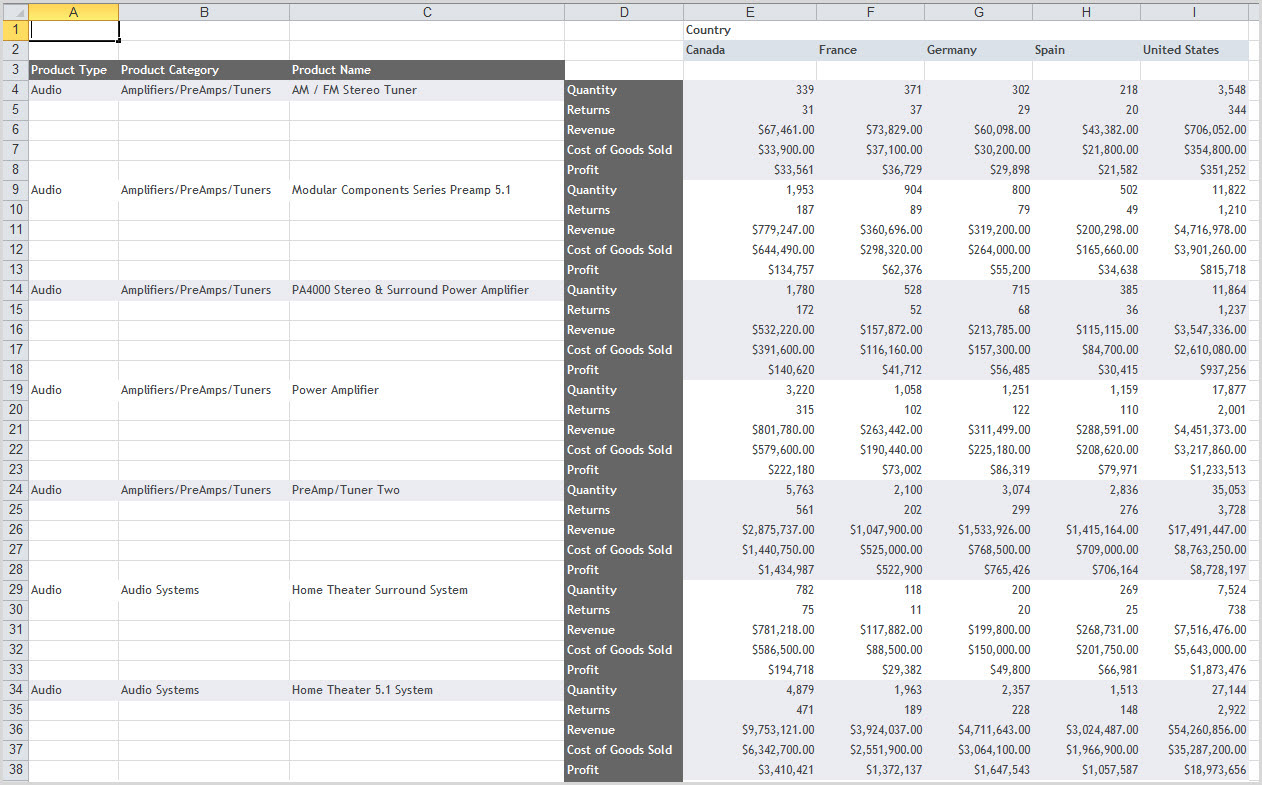
Figure 1: This spreadsheet shows an example of Sort Across and Stack Measures.
While this spreadsheet may meet all of the original report requirements, it's a lengthy report and there simply may be too much information for some users to digest. They might prefer to have the information broken into multiple worksheets—one for each product type. Such a feature is easily activated by turning on the Table of Contents feature under the Format tab.
When Table of Contents is activated, a separate worksheet for each unique value of the report's primary (first) Sort By column is created. Each worksheet contains the data for that particular Sort By column, and its tab is labeled with the appropriate Sort By field value. To activate Table of Contents, click the Format tab in InfoAssist, expand the Navigation group, and select Table of Contents icon. When activated, the icon is illuminated. An example is shown in Figure 2.

Figure 2 : Find the Table of Contents icon.
An example report is shown in Figure 3.
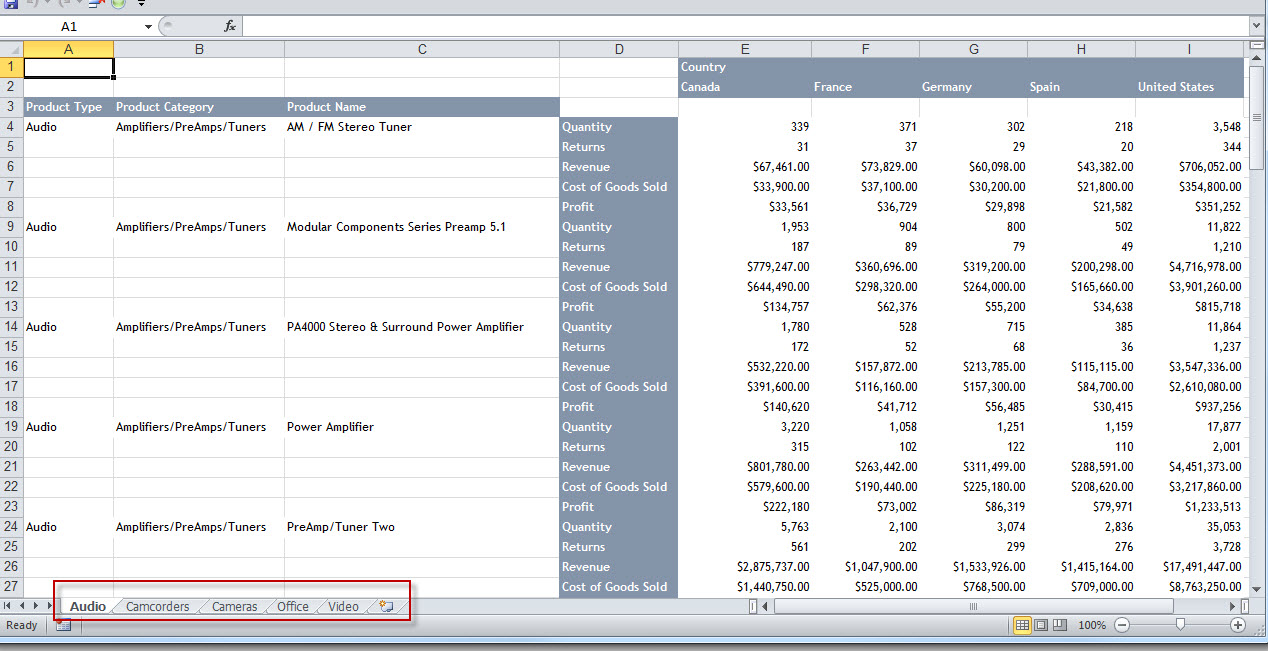
Figure 3: Here's an example of the report with Table of Contents.
Notice there are now five seprate worksheets, one for each unique Product Type. Simply click on the tab to display the worksheet for that particular product type. This effectively "splits up" the large report into separate smaller reports, but all the data is still together in a single spreadsheet!
Note: Table of Contents exhibits different behavior based on the report's specified output format. For example, if HTML or Active Reports is selected, an interactive dialog window is presented so that end users can select a Sort By field value and immediately "jump" to the first occurrence of that value in the report. This is especially useful for large HTML reports with many rows of data.
Compound Documents
The Table of Contents feature is very useful, but as mentioned, it's splitting up the results of a single report execution into multiple worksheets. What if you actually want to combine the results of different DB2 Web Query reports into one spreadsheet and have the results of each individual report appear in a separate worksheet? Is it possible to do this with DB2 Web Query? The answer is "Absolutely!"
In DB2 Web Query, you can combine multiple reports and/or charts into a single report. The result is referred to as a compound document (sometimes called a compound report), and the report developer can choose from a variety of output formats, such as PDF, HTML, Active Reports, and Excel Spreadsheets. If Excel is chosen, the result of each individual report and chart execution appears on a separate worksheet.
To create a compound document, right-click on the folder in which you wish to place the document and select Document, as shown in Figure 4.
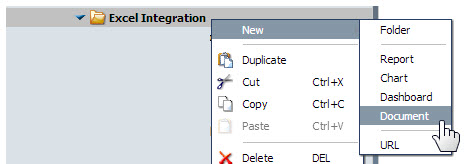
Figure 4: Create a compound document.
InfoAssist is launched and presents a list of data sources (DB2 Web Query synonyms) on which to base the various reports and charts in the compound document. Select the desired synonym from this list.
The default output format for compound documents is PDF. So the first thing we want to do is change it to Excel. From the Home tab, click on the PDF icon and select Excel from the drop-down list, as shown in Figure 5.
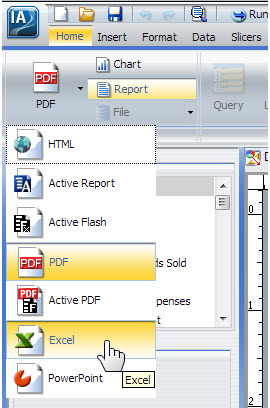
Figure 5: Change the document to Excel output format.
Now you're ready to insert multiple reports and/or charts. To do this, select the Insert tab, as shown in Figure 6.
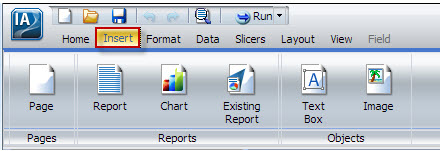
Figure 6: Select the Insert tab.
From this tab, you can create new reports or charts and insert them into the compound document. If you have existing reports or charts that you would like to insert, you can do that as well. In my finished example shown in Figure 7, I have inserted three different reports into my compound document.
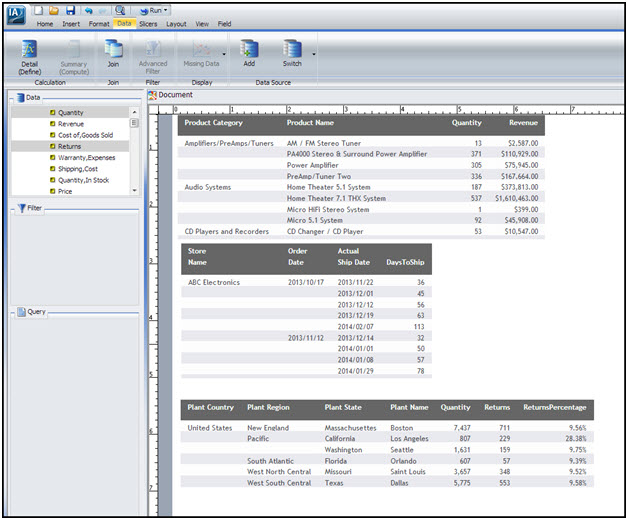
Figure 7: There are three reports in this example compound document.
Now when you save and run this report, Excel is launched and the compound document is presented in the spreadsheet. Notice in Figure 8, Figure 9, and Figure 10 that each individual report appears in a separate worksheet.
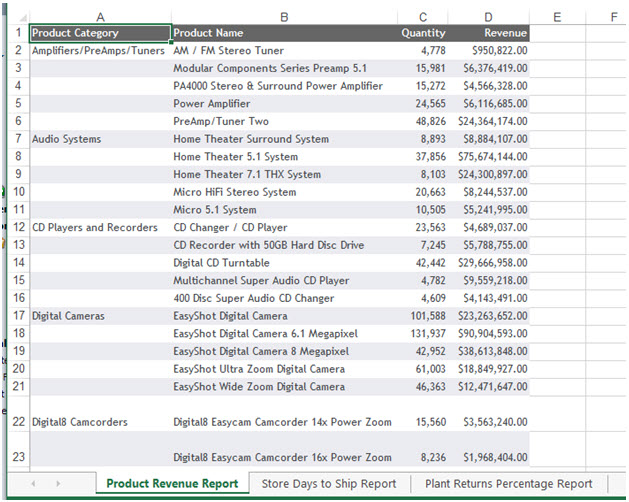
Figure 8: This example compound document shows worksheet 1.
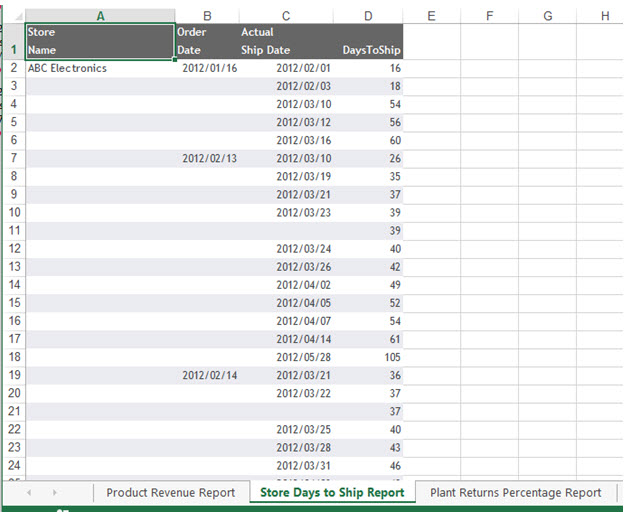
Figure 9: This example compound document shows worksheet 2.
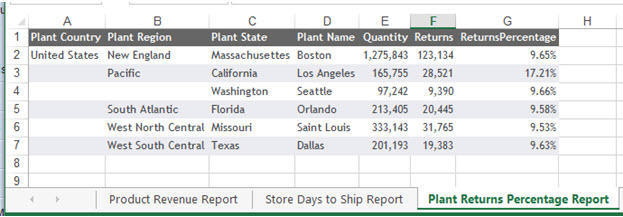
Figure 10: This example compound document shows worksheet 3.
Summary
By utilizing Excel's ability to have multiple worksheets in a single spreadsheet, you can split up and logically segment the results of a single report execution or you can combine multiple DB2 Web Query reports into one spreadsheet. Bringing these two technologies together means you can deliver the kinds of reports your users want and let them "take it from there."
In my next article in this series, I will introduce you to two additional Excel output options: Excel Formula and Excel Pivot. These formats have unique characteristics that you may find quite useful when trying to satisfy the reporting requirements of your end users!


 Business users want new applications now. Market and regulatory pressures require faster application updates and delivery into production. Your IBM i developers may be approaching retirement, and you see no sure way to fill their positions with experienced developers. In addition, you may be caught between maintaining your existing applications and the uncertainty of moving to something new.
 IT managers hoping to find new IBM i talent are discovering that the pool of experienced RPG programmers and operators or administrators with intimate knowledge of the operating system and the applications that run on it is small. This begs the question: How will you manage the platform that supports such a big part of your business? This guide offers strategies and software suggestions to help you plan IT staffing and resources and smooth the transition after your AS/400 talent retires. Read on to learn:
LATEST COMMENTS
MC Press Online