


Use this simple method to manage the display size of your reports.
When you create a dashboard in DB2 Web Query, it often contains a combination of graphs, reports, and, optionally, selection criteria. Because of changing criteria or business loads, the size required to display these reports changes. By default, Web Query uses fixed locations, which means that you need to plan for the largest size to avoid overlap. However, when you have smaller reports, this leads to large sections of undesired white space. In this TechTip, I will explain how to avoid this problem by using floating reports.
Within Developer Workbench, reports and graphs are both considered procedures. Therefore, while the following example shows two reports, it can be done with any combination of graphs and reports. Build your reports in the orientation that you want. This example focuses on the top-down style of floating reports. I made the frame as wide as I expect will be needed but as short as possible.

Figure 1: Make the frame as wide as necessary but short. (Click images to enlarge.)
For more precise alignment, use the toolbar buttons to make elements the same height or width or to align to common top, bottom, left, or right positions.

Figure 2: Don't forget to use the toolbar for better precision.
Set the desired gap size between the reports. Click the bottom report, hold control, and then click the top report. Now, click the Relate Bottom_Left button. If you were doing different orientations, you could choose any of the other "relate" buttons.
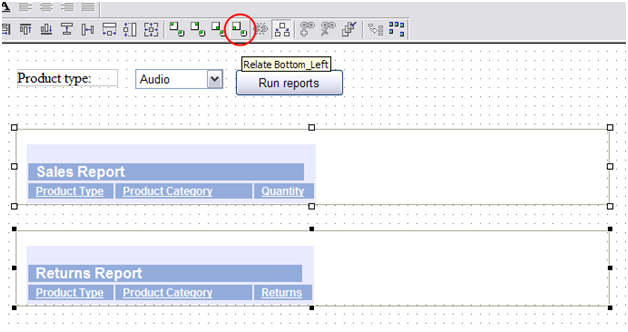
Figure 3: Notice the four "relate" options. I've highlighted Relate Bottom_Left.
You can see that this option created a relationship between the top left-hand corner of the bottom box and the bottom left-hand corner of the top box. The report will always maintain this gap.

Figure 4: You've set the desired spacing between reports.
You can add as many of these relationships as you would like, tops to bottoms and lefts to rights, to accommodate all the items on your dashboard.
Next, you need to tell the boxes to auto-adjust for content. By default, they will keep a fixed size and put in scroll bars if the content is too large for the size selected. However, since we made our boxes extremely short, they can only grow with the report, giving them an "auto-size" effect. To do this, you just set Sizing and Scrolling in the Properties panel to No for both reports.
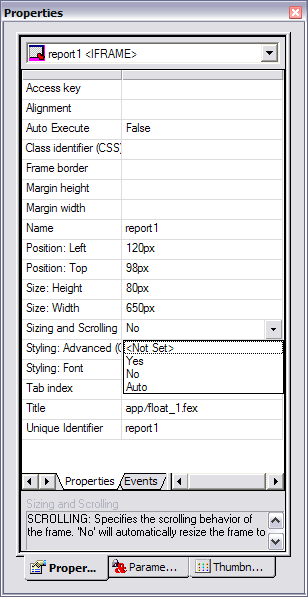
Figure 5: You can set Sizing and Scrolling in the Properties panel.
That's all there is to it. When you run the report, you will see the following. The initial report frames are blank. This is due to the fact that the reports defaulted the Auto Execute to false. If you would like the reports to be populated as soon as the report is run and before the selection criteria is set, change the Auto Execute property value to true (shown in Figure 5).

Figure 6: You're ready to run the report.
Notice you start with the frames the size you set. You then run for Audio and get that report.

Figure 7: You have your audio report!
You can see that the frames expanded to fit the content but maintained the set gap spacing. Run again, but this time for Camcorders.
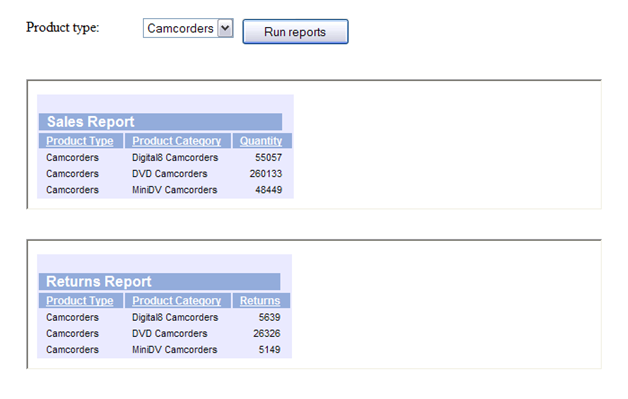
Figure 8: And here's your camcorder report.
Again, you see that the frames shrank but the gap stayed. Finally, run again for Cameras.
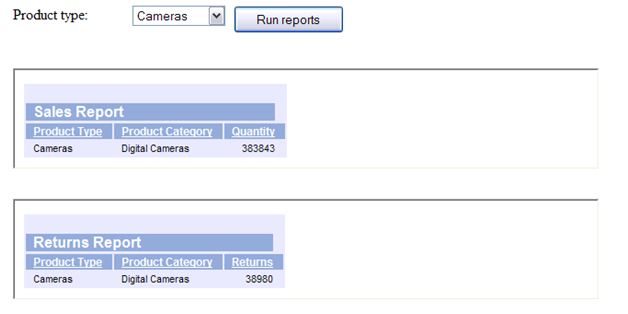
Figure 9: Note that all three reports maintained your settings.
As you can see, this option allows you to get a custom position for each element of your dashboard and create a smooth look without extra white space.

 Business users want new applications now. Market and regulatory pressures require faster application updates and delivery into production. Your IBM i developers may be approaching retirement, and you see no sure way to fill their positions with experienced developers. In addition, you may be caught between maintaining your existing applications and the uncertainty of moving to something new.
 IT managers hoping to find new IBM i talent are discovering that the pool of experienced RPG programmers and operators or administrators with intimate knowledge of the operating system and the applications that run on it is small. This begs the question: How will you manage the platform that supports such a big part of your business? This guide offers strategies and software suggestions to help you plan IT staffing and resources and smooth the transition after your AS/400 talent retires. Read on to learn:
LATEST COMMENTS
MC Press Online