(Note: The steps presented in this article are also compatible with IBM's Rational Application Developer product.)
Great! So Where Do I Start?
It's assumed that you have created an Eclipse-based Java project and have defined at least one application breakpoint (again, these steps are explained in the pre-requisite article).
Prepare the JVM for Remote Debugging
The first thing you will want to do is pass a few startup arguments to the JVM (i.e., arguments to the java command) to instruct it to start in debug mode:
-Xdebug –Xrunjdwp:transport=dt_socket,server=y,suspend=n,address=8000
These arguments specify the manner in which the Java debugger will operate. The transport=dt_socket construct specifies that debug connections will be made over TCP/IP sockets, and address=8000 specifies that port 8000 will be used. The suspend=n construct is also of crucial importance: When y is specified, the JVM will suspend itself until a debugger is attached to it; otherwise (i.e., when n is specified), the JVM immediately flows into its normal startup procedure.
Hook Up Eclipse to the JVM
The second step of the process is to attach the Eclipse debugger to the debuggable JVM started in the first step by following these simple steps:
- Within Eclipse, click on Run -> Debug....
- Click on Remote Java Application.
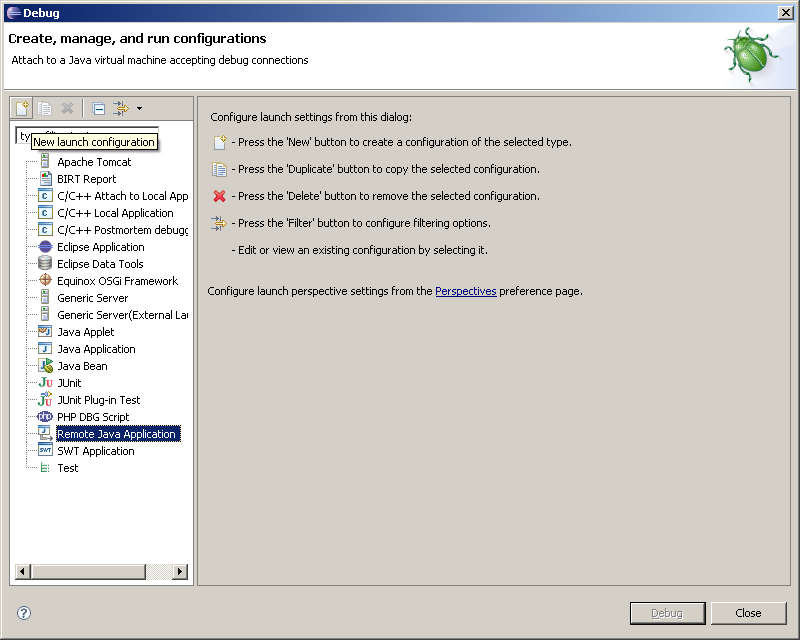
- Click the New Launch Configuration button in the upper left corner, as shown below in Figure 1.
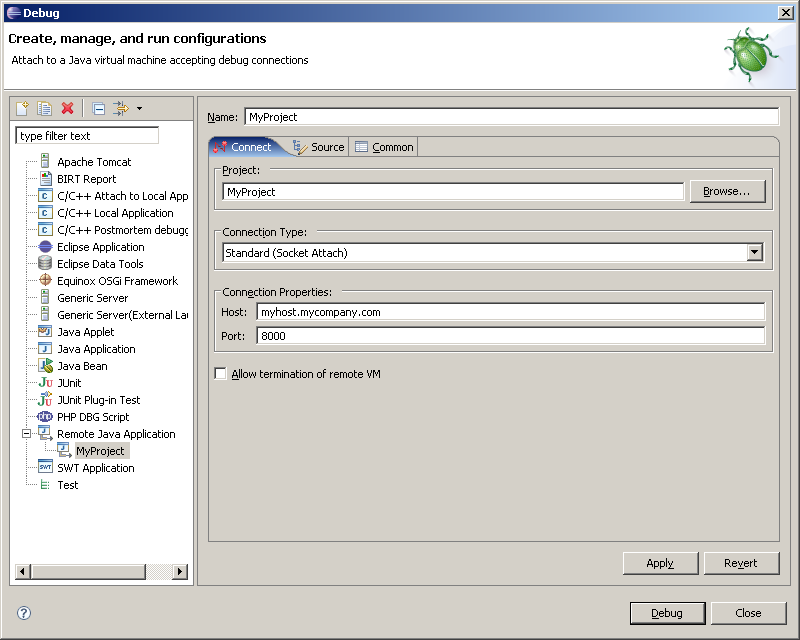
- Populate the fields specifying to which JVM Eclipse should converse, as shown below in Figure 2. Select Standard (Socket Attach) for the Connection Type. Fill in the host and port; the host is the system on which the JVM is running (this can even be localhost), and the port is the argument specified for the address construct handed to the JVM.
- Click Apply.
- Click Debug, which will attach the Eclipse-based Java debugger to the JVM specified in step 4.
Figure 1: Create a Remote Java Application configuration. (Click images to enlarge.)

Figure 2: Specify the JVM to which the debugger will attach.
Now you will be debugging just as if you were debugging a local application. That is, your breakpoints will fire when the remote JVM encounters them, pausing to allow you to resume, step in, step over, etc.
Parting Words of Advice
As demonstrated, once you have become comfortable using the Eclipse-based Java debugger to perform triage on local JVMs, it is a very natural extension to debug remote JVMs as there are very few additional steps. In the absence of this type of debugging support, a developer would be left stranded to cyclically change and re-deploy code cluttered with debug statements to diagnose problems on remote JVMs.
It is worth pointing out that these steps work on a wide variety of platforms, including the IBM System i. You can even change most J2EE application servers' startup scripts to include the provided JVM debug constructs to debug your J2EE applications.
If the possibility that you will be working with Java code that runs remotely from your workstation exists, this is information that you definitely will want to squirrel away. After you spend an hour or two becoming familiar with the debugger's general features, I can absolutely guarantee that you will never imagine your life without it.
Happy (remote) debugging!


 Business users want new applications now. Market and regulatory pressures require faster application updates and delivery into production. Your IBM i developers may be approaching retirement, and you see no sure way to fill their positions with experienced developers. In addition, you may be caught between maintaining your existing applications and the uncertainty of moving to something new.
 IT managers hoping to find new IBM i talent are discovering that the pool of experienced RPG programmers and operators or administrators with intimate knowledge of the operating system and the applications that run on it is small. This begs the question: How will you manage the platform that supports such a big part of your business? This guide offers strategies and software suggestions to help you plan IT staffing and resources and smooth the transition after your AS/400 talent retires. Read on to learn:
LATEST COMMENTS
MC Press Online