


Do your users constantly ask you to write this query or that data retrieval program? Do they complain that they have no easy way to retrieve and analyze data? Does that data retrieval product you installed sit idle because your users don't know the database well enough to use it? Even when you build a query for your users, are they frustrated because they then want to see the underlying detail? Is the setup, cost, and maintenance expense of an OLAP tool just too much? Do your users need real-time data access?
At ASC, we've perfected end user data access and analysis. With SEQUEL, you can create dynamic views that enable you to drill to any of the fields in the underlying files automatically, with no prior setup. With simple SEQUEL views, you can create analysis tools for business analysts and executives who aren't familiar with your database.
Consider this sales analysis example. You have three files: sales history, customer master, and item master. SEQUEL will join these three files; calculate sales, cost, margin, and margin percent; and summarize by sales region.

(Click images to enlarge.)
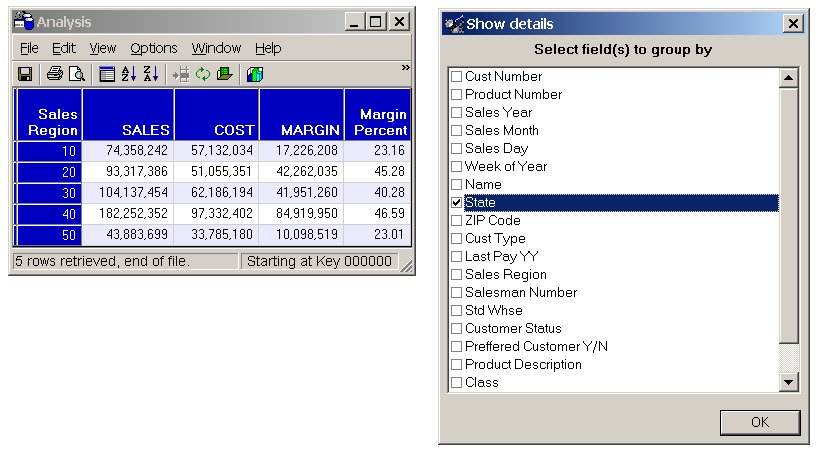
In the SEQUEL Viewpoint design screen, you prompt the database and define your view. This view summarizes the many records in the sales history file down to a single row for each sales region. You can output the results in various formats, including Excel, PDF, CSV, HTML, and XML.
You could get the same result with Query/400 or most any other data retrieval product. But this is a dynamic view. So, with no prior setup other than the above view definition, you can automatically drill into the fields in the underlying files (sales history, customer master, item master file) to present detail any way you need to see it. Or you can re-summarize the data with the same degree of flexibility.
Let's look at the drill-down options. By clicking on a button, you generate the following display. Suppose you'd like to know why sales region 50 has the lowest margin of all of the sales regions. Simply right-click anywhere on the region 50 line. Then, click on Show Details. The Show Details panel presents a list of the fields you can drill on. Suppose you want to see the sales region numbers broken out by state. Simply check the State field and click OK.
Now you see a list of the states in sales region 50, including the same sales, cost, margin, and margin percent format.
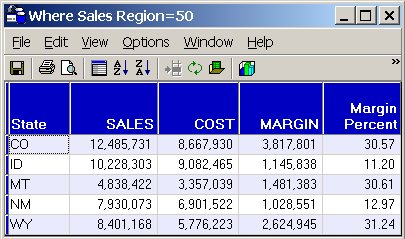
You can continue to drill into any of the other fields in the files or into a combination of fields. For example, you might drill from state to customer number, name, address, and sales rep. The margin percent figures are automatically recalculated at each level of display.
Instead of drill-down, you can also regroup the data by any of the fields in the list. You began by generating one summary row for each sales region. Now, you want to see all of the data in the files summarized by product class. Instead of clicking on Show Details, click on Regroup. SEQUEL will summarize on whatever field you select. If you select Sales Year, you would see the following display. In this figure, the margin percent column is charted.
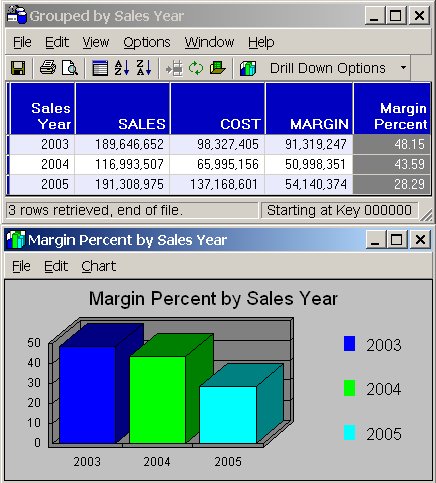
You can summarize, or group, on any field or fields. If you want to see the data aggregated by sales year and sales month, you check those fields. You can also alternate between regroup and drill-down. You might begin by showing a row for each sales year and then picking a year and drilling into month and then day. The idea is to provide the greatest possible flexibility in analyzing the data.
You can begin at the highest level of summarization and drill to the lowest level of detail. You can drill through three levels or thirty levels along any drill path you desire. The number of possible drill path combinations in this simple example is in the tens of millions. It would be virtually impossible to anticipate them all. Yet SEQUEL doesn't require you to predefine how your users can drill. With a dynamic view, the drill paths are up to the users and are predefined automatically as soon as the view is built.
SEQUEL dynamic views are scalable. They're perfect for business analysts because they require no familiarity with the database or SEQUEL syntax. You provide the business analyst with as much flexibility as possible with as little setup as possible.
Learn more about SEQUEL dynamic views by clicking here. And check out ASC's other offerings in the MC Showcase Buyer's Guide.
Charles Bernstein is Director of Database Products at Advanced Systems Concepts, Inc. He can be reached at 847.605.1311 x122 or
Partner TechTip: Data Retrieval Made Simple
Typography
- Smaller Small Medium Big Bigger
- Default Helvetica Segoe Georgia Times
- Reading Mode
 Business users want new applications now. Market and regulatory pressures require faster application updates and delivery into production. Your IBM i developers may be approaching retirement, and you see no sure way to fill their positions with experienced developers. In addition, you may be caught between maintaining your existing applications and the uncertainty of moving to something new.
 IT managers hoping to find new IBM i talent are discovering that the pool of experienced RPG programmers and operators or administrators with intimate knowledge of the operating system and the applications that run on it is small. This begs the question: How will you manage the platform that supports such a big part of your business? This guide offers strategies and software suggestions to help you plan IT staffing and resources and smooth the transition after your AS/400 talent retires. Read on to learn:
LATEST COMMENTS
MC Press Online