


IBM Navigator for i adds a new bird’s-eye-view performance interface in IBM i 7.3.
When talking about IBM i, it’s often stated that it’s the most securable operating system available, not necessarily the most secure. While IBM gives you the tools to ensure your system is secure, the human element must be considered. This is why it’s securable. Each operating system depends entirely on the system administrator to ensure doors are locked and windows are shut. This fact is true about many other aspects of the IBM i operating system, including performance. A system will perform as well as it’s configured to.
As part of the IBM i 7.3 release, IBM has released a number of new features to make identifying performance problems more obvious to the average system administrator. Most notably and obviously evident is the new Dashboard feature included inside IBM Navigator for i. Gone is the old “Welcome” page, which really offered nothing to a user. Instead, Dashboard is the initial page loaded once you log into Navigator for i, so you can’t miss it. You don’t need to turn it on or configure it. It’s just there as a great overview of the IBM i partition’s performance data.
Dashboard gives you a realtime view of CPU Utilization, Disk Pool Usage, Page Faults, Active Jobs, Disk Usage, and Operator Messages, each within it’s own mini pane. The Dashboard updates itself automatically by default; however, you may switch that to manual by a click of a button. You can also change the properties of automatic update by way of interval (how frequently the graph data is updated) and duration (length of time data is collected in the interval). The default data refresh is every second.
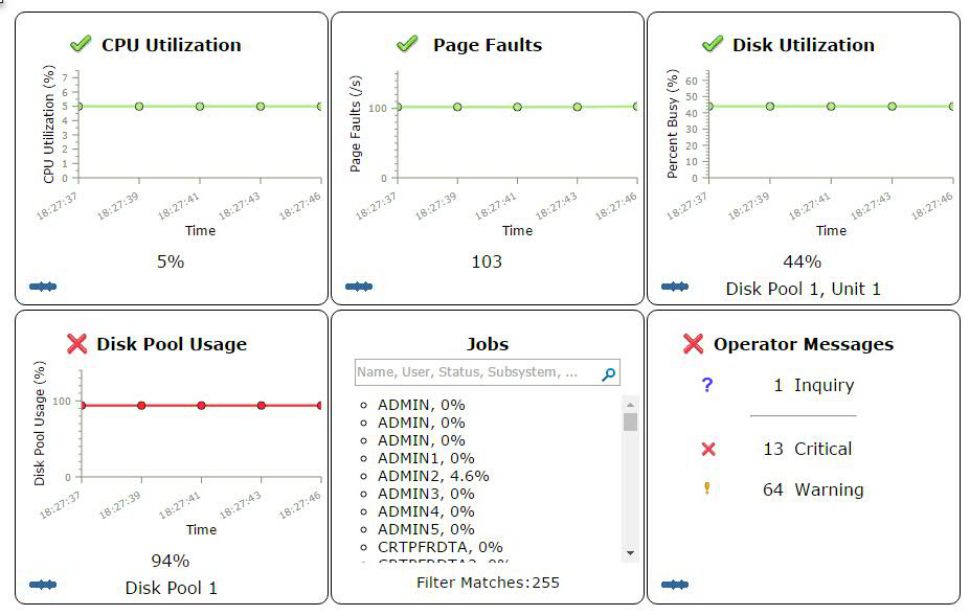
Figure 1: Dashboard in Navigator for i gives a bird's-eye view of performance.
Users can set thresholds by which to view the data. For instance, if you want the CPU line graph to display green when under 60%, yellow from 60-80%, and red from 81-100% utilization, it’s just a matter of dragging sliders on a slider bar. It’s very simple to customize based on your environment.
But the real value of Dashboard is the ability to right-click and get a contextual menu. If you right-click CPU, you can choose View Monitors, Investigate Monitor Data, or Investigate CPU data. It has the ability to take you directly into Performance Data Investigator and System Monitors so you can drill down and find the root causes of an underperforming metric. Dashboard is a simple starting point to identify problems and offers the ability to delve further into the already robust performance tools included in Navigator.
Rather than explain every right-click option in detail, I borrowed the following chart from the IBM i developerWorks page for Navigator. IBM was nice enough to create a very descriptive infographic about the drill-down options for Dashboard. But once you’re inside PDI, your choices can carry you even further down the path to identifying those problem root causes.
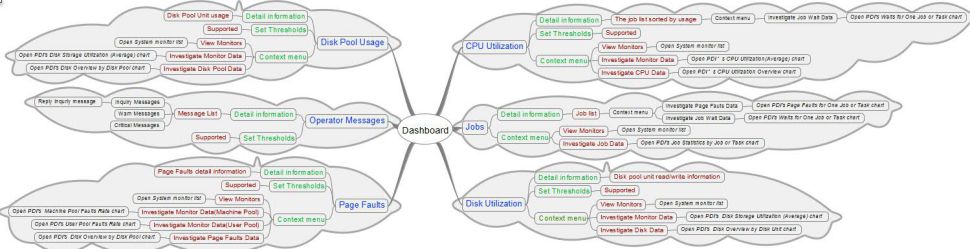
Figure 2: These are the drill-down options for Dashboard in Navigator for i.
Since this is Navigator, it’s got all the bells and whistles and polish of an administration tool. For the administrator on the move, the Dashboard feature is also included in IBM i Access for Mobile. This version works very similarly to the Navigator Dashboard; however, like all features of the mobile version of IBM i Access, it’s been optimized to fit on smaller screens. For the full experience, I’d recommend the full Navigator for i interface for any heavy lifting.
Navigator for i is here in a big way. We need to be aware that all new features are going to Navigator for i, and we need to take advantage of them. Performance monitoring in Navigator, while extremely valuable, is just the tip of the iceberg.

 Business users want new applications now. Market and regulatory pressures require faster application updates and delivery into production. Your IBM i developers may be approaching retirement, and you see no sure way to fill their positions with experienced developers. In addition, you may be caught between maintaining your existing applications and the uncertainty of moving to something new.
 IT managers hoping to find new IBM i talent are discovering that the pool of experienced RPG programmers and operators or administrators with intimate knowledge of the operating system and the applications that run on it is small. This begs the question: How will you manage the platform that supports such a big part of your business? This guide offers strategies and software suggestions to help you plan IT staffing and resources and smooth the transition after your AS/400 talent retires. Read on to learn:
LATEST COMMENTS
MC Press Online